* [RFC PATCH] perf tui: Annotate entries in callchains
@ 2015-03-19 22:58 Arnaldo Carvalho de Melo
  2015-03-20  0:34 ` Stephane Eranian
  0 siblings, 1 reply; 14+ messages in thread
From: Arnaldo Carvalho de Melo @ 2015-03-19 22:58 UTC (permalink / raw)
  To: Stephane Eranian
  Cc: Frederic Weisbecker, Namhyung Kim, Ingo Molnar, Peter Zijlstra,
	Jiri Olsa, David Ahern, Linux Kernel Mailing List,
	linux-perf-users

Hi Stephane,

	This patch, together with what is in my perf/core branch, should
implement that feature we talked about recently, i.e. to allow
annotating entries in callchains, please take a look at see if you think
it is ok,

- Arnaldo


From: Arnaldo Carvalho de Melo <acme@redhat.com>
Subject: [PATCH 1/1] perf hists browser: Indicate which callchain entries are annotated

Now that we can annotate entries in a callchain, show which ones have an
associated symbol and samples, by adding a right arrow just before the
symbol name when in verbose mode.

To toggle verbose mode press 'V'.

Cc: Adrian Hunter <adrian.hunter@intel.com>
Cc: Borislav Petkov <bp@suse.de>
Cc: David Ahern <dsahern@gmail.com>
Cc: Don Zickus <dzickus@redhat.com>
Cc: Frederic Weisbecker <fweisbec@gmail.com>
Cc: Jiri Olsa <jolsa@redhat.com>
Cc: Mike Galbraith <efault@gmx.de>
Cc: Namhyung Kim <namhyung@kernel.org>
Cc: Peter Zijlstra <peterz@infradead.org>
Cc: Stephane Eranian <eranian@google.com>
Link: http://lkml.kernel.org/n/tip-d2rf1p3h5gdp7hdl2gf2bozl@git.kernel.org
Signed-off-by: Arnaldo Carvalho de Melo <acme@redhat.com>
---
 tools/perf/ui/browsers/hists.c | 4 +++-
 1 file changed, 3 insertions(+), 1 deletion(-)

diff --git a/tools/perf/ui/browsers/hists.c b/tools/perf/ui/browsers/hists.c
index cd7350aeb8e7..995b7a8596b1 100644
--- a/tools/perf/ui/browsers/hists.c
+++ b/tools/perf/ui/browsers/hists.c
@@ -511,6 +511,7 @@ static void hist_browser__show_callchain_entry(struct hist_browser *browser,
 {
 	int color, width;
 	char folded_sign = callchain_list__folded(chain);
+	bool show_annotated = browser->show_dso && chain->ms.sym && symbol__annotation(chain->ms.sym)->src;

 	color = HE_COLORSET_NORMAL;
 	width = browser->b.width - (offset + 2);
@@ -523,7 +524,8 @@ static void hist_browser__show_callchain_entry(struct hist_browser *browser,
 	ui_browser__set_color(&browser->b, color);
 	hist_browser__gotorc(browser, row, 0);
 	slsmg_write_nstring(" ", offset);
-	slsmg_printf("%c ", folded_sign);
+	slsmg_printf("%c", folded_sign);
+	ui_browser__write_graph(&browser->b, show_annotated ? SLSMG_RARROW_CHAR : ' ');
 	slsmg_write_nstring(str, width);
 }

--
1.9.3

^ permalink raw reply related	[flat|nested] 14+ messages in thread
* Re: [RFC PATCH] perf tui: Annotate entries in callchains
  2015-03-19 22:58 [RFC PATCH] perf tui: Annotate entries in callchains Arnaldo Carvalho de Melo
@ 2015-03-20  0:34 ` Stephane Eranian
       [not found]   ` <CA+JHD93s2VkkdJMKZOGa6fPwEd43C8Ow80CU0b=bwTV=_8zjhw@mail.gmail.com>
  0 siblings, 1 reply; 14+ messages in thread
From: Stephane Eranian @ 2015-03-20  0:34 UTC (permalink / raw)
  To: Arnaldo Carvalho de Melo
  Cc: Frederic Weisbecker, Namhyung Kim, Ingo Molnar, Peter Zijlstra,
	Jiri Olsa, David Ahern, Linux Kernel Mailing List,
	linux-perf-users

Hi Arnaldo,

On Thu, Mar 19, 2015 at 3:58 PM, Arnaldo Carvalho de Melo
<acme@kernel.org> wrote:
>
> Hi Stephane,
>
>         This patch, together with what is in my perf/core branch, should
> implement that feature we talked about recently, i.e. to allow
> annotating entries in callchains, please take a look at see if you think
> it is ok,
>
I tried on tip.git and a simple example. It does what I wanted.
I will try on more complex test cases.
Thanks for implementing this quickly.

>
> - Arnaldo
>
>
> From: Arnaldo Carvalho de Melo <acme@redhat.com>
> Subject: [PATCH 1/1] perf hists browser: Indicate which callchain entries are annotated
>
> Now that we can annotate entries in a callchain, show which ones have an
> associated symbol and samples, by adding a right arrow just before the
> symbol name when in verbose mode.
>
> To toggle verbose mode press 'V'.
>
> Cc: Adrian Hunter <adrian.hunter@intel.com>
> Cc: Borislav Petkov <bp@suse.de>
> Cc: David Ahern <dsahern@gmail.com>
> Cc: Don Zickus <dzickus@redhat.com>
> Cc: Frederic Weisbecker <fweisbec@gmail.com>
> Cc: Jiri Olsa <jolsa@redhat.com>
> Cc: Mike Galbraith <efault@gmx.de>
> Cc: Namhyung Kim <namhyung@kernel.org>
> Cc: Peter Zijlstra <peterz@infradead.org>
> Cc: Stephane Eranian <eranian@google.com>
> Link: http://lkml.kernel.org/n/tip-d2rf1p3h5gdp7hdl2gf2bozl@git.kernel.org
> Signed-off-by: Arnaldo Carvalho de Melo <acme@redhat.com>
> ---
>  tools/perf/ui/browsers/hists.c | 4 +++-
>  1 file changed, 3 insertions(+), 1 deletion(-)
>
> diff --git a/tools/perf/ui/browsers/hists.c b/tools/perf/ui/browsers/hists.c
> index cd7350aeb8e7..995b7a8596b1 100644
> --- a/tools/perf/ui/browsers/hists.c
> +++ b/tools/perf/ui/browsers/hists.c
> @@ -511,6 +511,7 @@ static void hist_browser__show_callchain_entry(struct hist_browser *browser,
>  {
>         int color, width;
>         char folded_sign = callchain_list__folded(chain);
> +       bool show_annotated = browser->show_dso && chain->ms.sym && symbol__annotation(chain->ms.sym)->src;
>
>         color = HE_COLORSET_NORMAL;
>         width = browser->b.width - (offset + 2);
> @@ -523,7 +524,8 @@ static void hist_browser__show_callchain_entry(struct hist_browser *browser,
>         ui_browser__set_color(&browser->b, color);
>         hist_browser__gotorc(browser, row, 0);
>         slsmg_write_nstring(" ", offset);
> -       slsmg_printf("%c ", folded_sign);
> +       slsmg_printf("%c", folded_sign);
> +       ui_browser__write_graph(&browser->b, show_annotated ? SLSMG_RARROW_CHAR : ' ');
>         slsmg_write_nstring(str, width);
>  }
>
> --
> 1.9.3
>

^ permalink raw reply	[flat|nested] 14+ messages in thread
[parent not found: <CA+JHD93s2VkkdJMKZOGa6fPwEd43C8Ow80CU0b=bwTV=_8zjhw@mail.gmail.com>]
* Re: [RFC PATCH] perf tui: Annotate entries in callchains
       [not found]   ` <CA+JHD93s2VkkdJMKZOGa6fPwEd43C8Ow80CU0b=bwTV=_8zjhw@mail.gmail.com>
@ 2015-03-20 17:15     ` Stephane Eranian
  2015-03-20 17:21       ` Arnaldo Carvalho de Melo
  2015-03-20 20:39       ` Arnaldo Carvalho de Melo
  0 siblings, 2 replies; 14+ messages in thread
From: Stephane Eranian @ 2015-03-20 17:15 UTC (permalink / raw)
  To: Arnaldo Carvalho de Melo
  Cc: Linux Kernel Mailing List, Jiri Olsa, Peter Zijlstra,
	Frederic Weisbecker, linux-perf-users, David Ahern, Namhyung Kim,
	Arnaldo Carvalho de Melo, Ingo Molnar

Hi,

On Thu, Mar 19, 2015 at 5:39 PM, Arnaldo Carvalho de Melo
<arnaldo.melo@gmail.com> wrote:
> On Mar 19, 2015 9:34 PM, "Stephane Eranian" <eranian@google.com> wrote:
>>
>> Hi Arnaldo,
>>
>> On Thu, Mar 19, 2015 at 3:58 PM, Arnaldo Carvalho de Melo
>> <acme@kernel.org> wrote:
>> >
>> > Hi Stephane,
>> >
>> >         This patch, together with what is in my perf/core branch, should
>> > implement that feature we talked about recently, i.e. to allow
>> > annotating entries in callchains, please take a look at see if you think
>> > it is ok,
>> >
>> I tried on tip.git and a simple example. It does what I wanted.
>> I will try on more complex test cases.
>> Thanks for implementing this quickly.
>
> Thanks for testing, please let us know if you have further suggestions,
>
Ok, it does not work.
I think it works as long as the caller you want to annotate is in the
same module.
But suppose, I am on malloc() (libc) and I want to see a caller of
malloc(), it will
propose 'annotate bar()', but will still show me the code of libc:malloc.

In my earlier test, everything worked because the callee and caller were in the
same module.

Could you fix this?


> - Arnaldo
>
> Sent from smartphone
>
>
>>
>> >
>> > - Arnaldo
>> >
>> >
>> > From: Arnaldo Carvalho de Melo <acme@redhat.com>
>> > Subject: [PATCH 1/1] perf hists browser: Indicate which callchain
>> > entries are annotated
>> >
>> > Now that we can annotate entries in a callchain, show which ones have an
>> > associated symbol and samples, by adding a right arrow just before the
>> > symbol name when in verbose mode.
>> >
>> > To toggle verbose mode press 'V'.
>> >
>> > Cc: Adrian Hunter <adrian.hunter@intel.com>
>> > Cc: Borislav Petkov <bp@suse.de>
>> > Cc: David Ahern <dsahern@gmail.com>
>> > Cc: Don Zickus <dzickus@redhat.com>
>> > Cc: Frederic Weisbecker <fweisbec@gmail.com>
>> > Cc: Jiri Olsa <jolsa@redhat.com>
>> > Cc: Mike Galbraith <efault@gmx.de>
>> > Cc: Namhyung Kim <namhyung@kernel.org>
>> > Cc: Peter Zijlstra <peterz@infradead.org>
>> > Cc: Stephane Eranian <eranian@google.com>
>> > Link:
>> > http://lkml.kernel.org/n/tip-d2rf1p3h5gdp7hdl2gf2bozl@git.kernel.org
>> > Signed-off-by: Arnaldo Carvalho de Melo <acme@redhat.com>
>> > ---
>> >  tools/perf/ui/browsers/hists.c | 4 +++-
>> >  1 file changed, 3 insertions(+), 1 deletion(-)
>> >
>> > diff --git a/tools/perf/ui/browsers/hists.c
>> > b/tools/perf/ui/browsers/hists.c
>> > index cd7350aeb8e7..995b7a8596b1 100644
>> > --- a/tools/perf/ui/browsers/hists.c
>> > +++ b/tools/perf/ui/browsers/hists.c
>> > @@ -511,6 +511,7 @@ static void
>> > hist_browser__show_callchain_entry(struct hist_browser *browser,
>> >  {
>> >         int color, width;
>> >         char folded_sign = callchain_list__folded(chain);
>> > +       bool show_annotated = browser->show_dso && chain->ms.sym &&
>> > symbol__annotation(chain->ms.sym)->src;
>> >
>> >         color = HE_COLORSET_NORMAL;
>> >         width = browser->b.width - (offset + 2);
>> > @@ -523,7 +524,8 @@ static void
>> > hist_browser__show_callchain_entry(struct hist_browser *browser,
>> >         ui_browser__set_color(&browser->b, color);
>> >         hist_browser__gotorc(browser, row, 0);
>> >         slsmg_write_nstring(" ", offset);
>> > -       slsmg_printf("%c ", folded_sign);
>> > +       slsmg_printf("%c", folded_sign);
>> > +       ui_browser__write_graph(&browser->b, show_annotated ?
>> > SLSMG_RARROW_CHAR : ' ');
>> >         slsmg_write_nstring(str, width);
>> >  }
>> >
>> > --
>> > 1.9.3
>> >

^ permalink raw reply	[flat|nested] 14+ messages in thread
* Re: [RFC PATCH] perf tui: Annotate entries in callchains
  2015-03-20 17:15     ` Stephane Eranian
@ 2015-03-20 17:21       ` Arnaldo Carvalho de Melo
  2015-03-20 20:39       ` Arnaldo Carvalho de Melo
  1 sibling, 0 replies; 14+ messages in thread
From: Arnaldo Carvalho de Melo @ 2015-03-20 17:21 UTC (permalink / raw)
  To: Stephane Eranian
  Cc: Linux Kernel Mailing List, Jiri Olsa, Peter Zijlstra,
	Frederic Weisbecker, linux-perf-users, David Ahern, Namhyung Kim,
	Arnaldo Carvalho de Melo, Ingo Molnar


On March 20, 2015 2:15:53 PM GMT-03:00, Stephane Eranian <eranian@google.com> wrote:
>> Thanks for testing, please let us know if you have further
>suggestions,
>>
>Ok, it does not work.
>I think it works as long as the caller you want to annotate is in the
>same module.
>But suppose, I am on malloc() (libc) and I want to see a caller of
>malloc(), it will
>propose 'annotate bar()', but will still show me the code of
>libc:malloc.
>
>In my earlier test, everything worked because the callee and caller
>were in the
>same module.
>
>Could you fix this?

I'll try.


>
>
>> - Arnaldo
>>
>> Sent from smartphone
>>
>>
>>>
>>> >
>>> > - Arnaldo
>>> >
>>> >
>>> > From: Arnaldo Carvalho de Melo <acme@redhat.com>
>>> > Subject: [PATCH 1/1] perf hists browser: Indicate which callchain
>>> > entries are annotated
>>> >
>>> > Now that we can annotate entries in a callchain, show which ones
>have an
>>> > associated symbol and samples, by adding a right arrow just before
>the
>>> > symbol name when in verbose mode.
>>> >
>>> > To toggle verbose mode press 'V'.
>>> >
>>> > Cc: Adrian Hunter <adrian.hunter@intel.com>
>>> > Cc: Borislav Petkov <bp@suse.de>
>>> > Cc: David Ahern <dsahern@gmail.com>
>>> > Cc: Don Zickus <dzickus@redhat.com>
>>> > Cc: Frederic Weisbecker <fweisbec@gmail.com>
>>> > Cc: Jiri Olsa <jolsa@redhat.com>
>>> > Cc: Mike Galbraith <efault@gmx.de>
>>> > Cc: Namhyung Kim <namhyung@kernel.org>
>>> > Cc: Peter Zijlstra <peterz@infradead.org>
>>> > Cc: Stephane Eranian <eranian@google.com>
>>> > Link:
>>> >
>http://lkml.kernel.org/n/tip-d2rf1p3h5gdp7hdl2gf2bozl@git.kernel.org
>>> > Signed-off-by: Arnaldo Carvalho de Melo <acme@redhat.com>
>>> > ---
>>> >  tools/perf/ui/browsers/hists.c | 4 +++-
>>> >  1 file changed, 3 insertions(+), 1 deletion(-)
>>> >
>>> > diff --git a/tools/perf/ui/browsers/hists.c
>>> > b/tools/perf/ui/browsers/hists.c
>>> > index cd7350aeb8e7..995b7a8596b1 100644
>>> > --- a/tools/perf/ui/browsers/hists.c
>>> > +++ b/tools/perf/ui/browsers/hists.c
>>> > @@ -511,6 +511,7 @@ static void
>>> > hist_browser__show_callchain_entry(struct hist_browser *browser,
>>> >  {
>>> >         int color, width;
>>> >         char folded_sign = callchain_list__folded(chain);
>>> > +       bool show_annotated = browser->show_dso && chain->ms.sym
>&&
>>> > symbol__annotation(chain->ms.sym)->src;
>>> >
>>> >         color = HE_COLORSET_NORMAL;
>>> >         width = browser->b.width - (offset + 2);
>>> > @@ -523,7 +524,8 @@ static void
>>> > hist_browser__show_callchain_entry(struct hist_browser *browser,
>>> >         ui_browser__set_color(&browser->b, color);
>>> >         hist_browser__gotorc(browser, row, 0);
>>> >         slsmg_write_nstring(" ", offset);
>>> > -       slsmg_printf("%c ", folded_sign);
>>> > +       slsmg_printf("%c", folded_sign);
>>> > +       ui_browser__write_graph(&browser->b, show_annotated ?
>>> > SLSMG_RARROW_CHAR : ' ');
>>> >         slsmg_write_nstring(str, width);
>>> >  }
>>> >
>>> > --
>>> > 1.9.3
>>> >

-- Arnaldo

Sent from smartphone.

^ permalink raw reply	[flat|nested] 14+ messages in thread
* Re: [RFC PATCH] perf tui: Annotate entries in callchains
  2015-03-20 17:15     ` Stephane Eranian
  2015-03-20 17:21       ` Arnaldo Carvalho de Melo
@ 2015-03-20 20:39       ` Arnaldo Carvalho de Melo
  2015-03-20 21:07         ` Arnaldo Carvalho de Melo
  1 sibling, 1 reply; 14+ messages in thread
From: Arnaldo Carvalho de Melo @ 2015-03-20 20:39 UTC (permalink / raw)
  To: Stephane Eranian
  Cc: Linux Kernel Mailing List, Jiri Olsa, Peter Zijlstra,
	Frederic Weisbecker, linux-perf-users, David Ahern, Namhyung Kim,
	Ingo Molnar

Em Fri, Mar 20, 2015 at 10:15:53AM -0700, Stephane Eranian escreveu:
> Hi,
>
> On Thu, Mar 19, 2015 at 5:39 PM, Arnaldo Carvalho de Melo
> <arnaldo.melo@gmail.com> wrote:
> > On Mar 19, 2015 9:34 PM, "Stephane Eranian" <eranian@google.com> wrote:
> >>
> >> Hi Arnaldo,
> >>
> >> On Thu, Mar 19, 2015 at 3:58 PM, Arnaldo Carvalho de Melo
> >> <acme@kernel.org> wrote:
> >> >
> >> > Hi Stephane,
> >> >
> >> >         This patch, together with what is in my perf/core branch, should
> >> > implement that feature we talked about recently, i.e. to allow
> >> > annotating entries in callchains, please take a look at see if you think
> >> > it is ok,
> >> >
> >> I tried on tip.git and a simple example. It does what I wanted.
> >> I will try on more complex test cases.
> >> Thanks for implementing this quickly.
> >
> > Thanks for testing, please let us know if you have further suggestions,
> >
> Ok, it does not work.
> I think it works as long as the caller you want to annotate is in the
> same module.
> But suppose, I am on malloc() (libc) and I want to see a caller of
> malloc(), it will
> propose 'annotate bar()', but will still show me the code of libc:malloc.
>
> In my earlier test, everything worked because the callee and caller were in the
> same module.
>
> Could you fix this?

I thought that was covered because it deals with a "map_symbol" struct,
where it finds both the symbol and the DSO where it came from, etc.

Checking that now...


- Arnaldo

^ permalink raw reply	[flat|nested] 14+ messages in thread
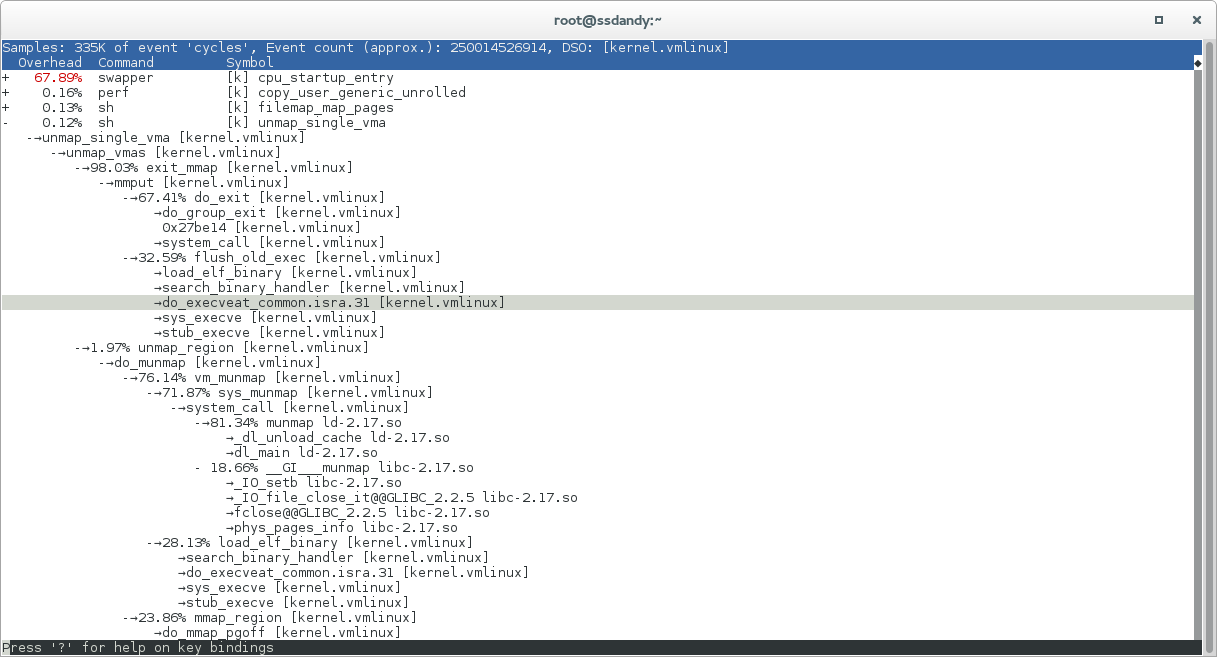
* Re: [RFC PATCH] perf tui: Annotate entries in callchains
  2015-03-20 20:39       ` Arnaldo Carvalho de Melo
@ 2015-03-20 21:07         ` Arnaldo Carvalho de Melo
  2015-03-20 21:12           ` Stephane Eranian
  0 siblings, 1 reply; 14+ messages in thread
From: Arnaldo Carvalho de Melo @ 2015-03-20 21:07 UTC (permalink / raw)
  To: Stephane Eranian
  Cc: Linux Kernel Mailing List, Jiri Olsa, Peter Zijlstra,
	Frederic Weisbecker, linux-perf-users, David Ahern, Namhyung Kim,
	Ingo Molnar

Em Fri, Mar 20, 2015 at 05:39:22PM -0300, Arnaldo Carvalho de Melo escreveu:
> Em Fri, Mar 20, 2015 at 10:15:53AM -0700, Stephane Eranian escreveu:
> > On Thu, Mar 19, 2015 at 5:39 PM, Arnaldo Carvalho de Melo <arnaldo.melo@gmail.com> wrote:
> > > On Mar 19, 2015 9:34 PM, "Stephane Eranian" <eranian@google.com> wrote:
> > >> On Thu, Mar 19, 2015 at 3:58 PM, Arnaldo Carvalho de Melo
> > >> <acme@kernel.org> wrote:
> > >> >         This patch, together with what is in my perf/core branch, should
> > >> > implement that feature we talked about recently, i.e. to allow
> > >> > annotating entries in callchains, please take a look at see if you think
> > >> > it is ok,

> > >> I tried on tip.git and a simple example. It does what I wanted.
> > >> I will try on more complex test cases.
> > >> Thanks for implementing this quickly.

> > > Thanks for testing, please let us know if you have further suggestions,

> > Ok, it does not work.

Are you sure? I just tried, take a look at:

http://vger.kernel.org/~acme/perf-report-annotate-callchain-entries-in-multiple-DSOs-in-the-same-hist_entry.png

In there you will see that in the unmap_single_vma case there are
callchains that pass thru multiple DSOs in userspace (I used --call
dwarf in 'perf record') and those are marked as having
samples/annotation and when I go to those, pressing 'a' after moving the
cursor to it and it works as expected...

Do you have some specific example I could try?

- Arnaldo


> > I think it works as long as the caller you want to annotate is in the
> > same module.
> > But suppose, I am on malloc() (libc) and I want to see a caller of
> > malloc(), it will
> > propose 'annotate bar()', but will still show me the code of libc:malloc.
> >
> > In my earlier test, everything worked because the callee and caller were in the
> > same module.
> >
> > Could you fix this?
>
> I thought that was covered because it deals with a "map_symbol" struct,
> where it finds both the symbol and the DSO where it came from, etc.
>
> Checking that now...
>
>
> - Arnaldo

^ permalink raw reply	[flat|nested] 14+ messages in thread
* Re: [RFC PATCH] perf tui: Annotate entries in callchains
  2015-03-20 21:07         ` Arnaldo Carvalho de Melo
@ 2015-03-20 21:12           ` Stephane Eranian
  2015-03-20 21:34             ` Arnaldo Carvalho de Melo
  2015-03-23  0:27             ` Namhyung Kim
  0 siblings, 2 replies; 14+ messages in thread
From: Stephane Eranian @ 2015-03-20 21:12 UTC (permalink / raw)
  To: Arnaldo Carvalho de Melo
  Cc: Linux Kernel Mailing List, Jiri Olsa, Peter Zijlstra,
	Frederic Weisbecker, linux-perf-users, David Ahern, Namhyung Kim,
	Ingo Molnar

On Fri, Mar 20, 2015 at 2:07 PM, Arnaldo Carvalho de Melo
<arnaldo.melo@gmail.com> wrote:
> Em Fri, Mar 20, 2015 at 05:39:22PM -0300, Arnaldo Carvalho de Melo escreveu:
>> Em Fri, Mar 20, 2015 at 10:15:53AM -0700, Stephane Eranian escreveu:
>> > On Thu, Mar 19, 2015 at 5:39 PM, Arnaldo Carvalho de Melo <arnaldo.melo@gmail.com> wrote:
>> > > On Mar 19, 2015 9:34 PM, "Stephane Eranian" <eranian@google.com> wrote:
>> > >> On Thu, Mar 19, 2015 at 3:58 PM, Arnaldo Carvalho de Melo
>> > >> <acme@kernel.org> wrote:
>> > >> >         This patch, together with what is in my perf/core branch, should
>> > >> > implement that feature we talked about recently, i.e. to allow
>> > >> > annotating entries in callchains, please take a look at see if you think
>> > >> > it is ok,
>
>> > >> I tried on tip.git and a simple example. It does what I wanted.
>> > >> I will try on more complex test cases.
>> > >> Thanks for implementing this quickly.
>
>> > > Thanks for testing, please let us know if you have further suggestions,
>
>> > Ok, it does not work.
>
> Are you sure? I just tried, take a look at:
>
> http://vger.kernel.org/~acme/perf-report-annotate-callchain-entries-in-multiple-DSOs-in-the-same-hist_entry.png
>
> In there you will see that in the unmap_single_vma case there are
> callchains that pass thru multiple DSOs in userspace (I used --call
> dwarf in 'perf record') and those are marked as having
> samples/annotation and when I go to those, pressing 'a' after moving the
> cursor to it and it works as expected...
>
> Do you have some specific example I could try?
>
I tried on an example I cannot share.
But I am guessing you could reproduce with a test which calls a libc
or libm function
heavily form multiple callers in the main program.
Example:
       -  pow()
           50% foo() [main.c]
           50% bar() [main.c]

If I move the cursor line to foo() and annotate foo() is shows me the
code of pow().

>> > I think it works as long as the caller you want to annotate is in the
>> > same module.
>> > But suppose, I am on malloc() (libc) and I want to see a caller of
>> > malloc(), it will
>> > propose 'annotate bar()', but will still show me the code of libc:malloc.
>> >
>> > In my earlier test, everything worked because the callee and caller were in the
>> > same module.
>> >
>> > Could you fix this?
>>
>> I thought that was covered because it deals with a "map_symbol" struct,
>> where it finds both the symbol and the DSO where it came from, etc.
>>
>> Checking that now...
>>
>>
>> - Arnaldo

^ permalink raw reply	[flat|nested] 14+ messages in thread
* Re: [RFC PATCH] perf tui: Annotate entries in callchains
  2015-03-20 21:12           ` Stephane Eranian
@ 2015-03-20 21:34             ` Arnaldo Carvalho de Melo
  2015-03-20 21:45               ` Arnaldo Carvalho de Melo
  2015-03-23  0:27             ` Namhyung Kim
  1 sibling, 1 reply; 14+ messages in thread
From: Arnaldo Carvalho de Melo @ 2015-03-20 21:34 UTC (permalink / raw)
  To: Stephane Eranian
  Cc: Linux Kernel Mailing List, Jiri Olsa, Peter Zijlstra,
	Frederic Weisbecker, linux-perf-users, David Ahern, Namhyung Kim,
	Ingo Molnar

Em Fri, Mar 20, 2015 at 02:12:30PM -0700, Stephane Eranian escreveu:
> On Fri, Mar 20, 2015 at 2:07 PM, Arnaldo Carvalho de Melo
> <arnaldo.melo@gmail.com> wrote:
> > Em Fri, Mar 20, 2015 at 05:39:22PM -0300, Arnaldo Carvalho de Melo escreveu:
> >> Em Fri, Mar 20, 2015 at 10:15:53AM -0700, Stephane Eranian escreveu:
> >> > On Thu, Mar 19, 2015 at 5:39 PM, Arnaldo Carvalho de Melo <arnaldo.melo@gmail.com> wrote:
> >> > > On Mar 19, 2015 9:34 PM, "Stephane Eranian" <eranian@google.com> wrote:
> >> > >> On Thu, Mar 19, 2015 at 3:58 PM, Arnaldo Carvalho de Melo
> >> > >> <acme@kernel.org> wrote:
> >> > >> >         This patch, together with what is in my perf/core branch, should
> >> > >> > implement that feature we talked about recently, i.e. to allow
> >> > >> > annotating entries in callchains, please take a look at see if you think
> >> > >> > it is ok,

> >> > >> I tried on tip.git and a simple example. It does what I wanted.
> >> > >> I will try on more complex test cases.
> >> > >> Thanks for implementing this quickly.

> >> > > Thanks for testing, please let us know if you have further suggestions,

> >> > Ok, it does not work.
> >
> > Are you sure? I just tried, take a look at:
> >
> > http://vger.kernel.org/~acme/perf-report-annotate-callchain-entries-in-multiple-DSOs-in-the-same-hist_entry.png
> >
> > In there you will see that in the unmap_single_vma case there are
> > callchains that pass thru multiple DSOs in userspace (I used --call
> > dwarf in 'perf record') and those are marked as having
> > samples/annotation and when I go to those, pressing 'a' after moving the
> > cursor to it and it works as expected...

> > Do you have some specific example I could try?

> I tried on an example I cannot share.
> But I am guessing you could reproduce with a test which calls a libc
> or libm function
> heavily form multiple callers in the main program.
> Example:
>        -  pow()
>            50% foo() [main.c]
>            50% bar() [main.c]
>
> If I move the cursor line to foo() and annotate foo() is shows me the
> code of pow().

+   49.83%  pow-me-harder  pow-me-harder     [.] main
+   27.16%  pow-me-harder  libm-2.17.so      [.] __ieee754_pow_sse2
-   17.76%  pow-me-harder  libm-2.17.so      [.] __pow
   -→__pow libm-2.17.so
      -→80.70% main pow-me-harder
           __libc_start_main libc-2.17.so
           _start pow-me-harder
        16.82% 0x4000000000000000 unknown
        2.44% 0x1 unknown
+    2.57%  pow-me-harder  pow-me-harder     [.] pow@plt
+    2.36%  pow-me-harder  libm-2.17.so      [.] @plt
+    0.04%  pow-me-harder  [kernel.vmlinux]  [k] intel_thermal_interrupt

And if I go to the line:

-→80.70% main pow-me-harder

And press 'a' I get:

main  /home/acme/pow-me-harder
 10.25 │ 3e:   mov    -0x10(%rbp),%rax
  1.03 │       test   %rax,%rax
  4.39 │     ↓ js     53
  3.87 │       cvtsi2 %rax,%xmm3
  1.63 │       movsd  %xmm3,-0x38(%rbp)
       │     ↓ jmp    71
  0.03 │ 53:   mov    %rax,%rdx
  0.91 │       shr    %rdx
  0.29 │       and    $0x1,%eax
  1.85 │       or     %rax,%rdx
  7.38 │       cvtsi2 %rdx,%xmm0
  0.55 │       movapd %xmm0,%xmm2
  6.54 │       addsd  %xmm0,%xmm2
  0.68 │       movsd  %xmm2,-0x38(%rbp)
  1.44 │ 71:   cvtsi2 -0x4(%rbp),%xmm0
  2.82 │       movabs $0x4000000000000000,%rax
  0.62 │       mov    %rax,-0x40(%rbp)
  0.07 │       movsd  -0x40(%rbp),%xmm1
  4.30 │     → callq  pow@plt
  1.53 │       addsd  -0x38(%rbp),%xmm0
  4.13 │       ucomis 0xfd(%rip),%xmm0        # 400818 <__dso_handle+0x10>
  4.06 │     ↓ jae    a8
  1.49 │       cvttsd %xmm0,%rax
  1.49 │       mov    %rax,-0x10(%rbp)
  0.35 │     ↓ jmp    cb
       │ a8:   movsd  0xe8(%rip),%xmm1        # 400818 <__dso_handle+0x10>
  0.14 │       subsd  %xmm1,%xmm0
  2.57 │       cvttsd %xmm0,%rax
  0.66 │       mov    %rax,-0x10(%rbp)
       │       movabs $0x8000000000000000,%rax
  7.84 │       xor    %rax,-0x10(%rbp)
 16.80 │ cb:   mov    -0x10(%rbp),%rax
  2.15 │       mov    %rax,-0x10(%rbp)
       │     int main(int argc, char *argv[])
       │     {
       │             int n = atoi(argv[1]), i;
       │             unsigned long long total = 0;

While if I go to the line:

   -→__pow libm-2.17.so

And press 'a', I get:

__pow  /usr/lib64/libm-2.17.so
       │     Disassembly of section .text:
       │
       │     0000000000026290 <pow>:
       │     __pow():
       │       movapd %xmm0,%xmm2
       │       sub    $0x18,%rsp
  1.70 │       movapd %xmm1,%xmm3
 12.86 │       movsd  %xmm2,(%rsp)
       │       movsd  %xmm3,0x8(%rsp)
  2.43 │     → callq  *ABS*+0x1b110@plt
  0.49 │       movabs $0x7fffffffffffffff,%rcx
  0.28 │       movabs $0x7fefffffffffffff,%rdx
  1.01 │       movq   %xmm0,%rax
 12.58 │       and    %rcx,%rax
  2.18 │       movsd  (%rsp),%xmm2
  1.29 │       cmp    %rdx,%rax
 19.70 │       movsd  0x8(%rsp),%xmm3
  1.50 │     ↓ ja     57
  1.58 │       xorpd  %xmm1,%xmm1
 13.35 │       ucomis %xmm1,%xmm0
  0.89 │     ↓ jnp    a0
       │ 52:   add    $0x18,%rsp
 16.83 │     ← retq
       │ 57:   mov    _DYNAMIC+0x230,%rsi
       │       cmpl   $0xffffffff,(%rsi)
       │     ↑ je     52


Since I don't have glibc-debuginfo installed, I get just assembly.

[acme@ssdandy linux]$ readelf -sw /usr/lib64/libm-2.17.so | grep -w __pow
  1737: 0000000000026290   429 FUNC    LOCAL  DEFAULT   13 __pow
[acme@ssdandy linux]$

Strange, are you pressing 'V' on the main 'perf record' view, i.e. before
getting to the annotation browser, to see the DSO just after the symbol?

Trying with a deeper callchain in pow-me-harder.c...

- Arnaldo

^ permalink raw reply	[flat|nested] 14+ messages in thread
* Re: [RFC PATCH] perf tui: Annotate entries in callchains
  2015-03-20 21:34             ` Arnaldo Carvalho de Melo
@ 2015-03-20 21:45               ` Arnaldo Carvalho de Melo
  0 siblings, 0 replies; 14+ messages in thread
From: Arnaldo Carvalho de Melo @ 2015-03-20 21:45 UTC (permalink / raw)
  To: Stephane Eranian
  Cc: Linux Kernel Mailing List, Jiri Olsa, Peter Zijlstra,
	Frederic Weisbecker, linux-perf-users, David Ahern, Namhyung Kim,
	Ingo Molnar

Em Fri, Mar 20, 2015 at 06:34:29PM -0300, Arnaldo Carvalho de Melo escreveu:
> Strange, are you pressing 'V' on the main 'perf record' view, i.e. before
> getting to the annotation browser, to see the DSO just after the symbol?
>
> Trying with a deeper callchain in pow-me-harder.c...

I'm not being able to reproduce this, out of ideas, back to processing
some other patches, please let me know about any news on your side :-\

- Arnaldo

^ permalink raw reply	[flat|nested] 14+ messages in thread
* Re: [RFC PATCH] perf tui: Annotate entries in callchains
  2015-03-20 21:12           ` Stephane Eranian
  2015-03-20 21:34             ` Arnaldo Carvalho de Melo
@ 2015-03-23  0:27             ` Namhyung Kim
  2015-03-23 16:49               ` Stephane Eranian
  1 sibling, 1 reply; 14+ messages in thread
From: Namhyung Kim @ 2015-03-23  0:27 UTC (permalink / raw)
  To: Stephane Eranian
  Cc: Arnaldo Carvalho de Melo, Linux Kernel Mailing List, Jiri Olsa,
	Peter Zijlstra, Frederic Weisbecker, linux-perf-users,
	David Ahern, Ingo Molnar

Hi Stephane,

On Fri, Mar 20, 2015 at 02:12:30PM -0700, Stephane Eranian wrote:
> On Fri, Mar 20, 2015 at 2:07 PM, Arnaldo Carvalho de Melo
> <arnaldo.melo@gmail.com> wrote:
> > Em Fri, Mar 20, 2015 at 05:39:22PM -0300, Arnaldo Carvalho de Melo escreveu:
> >> Em Fri, Mar 20, 2015 at 10:15:53AM -0700, Stephane Eranian escreveu:
> >> > On Thu, Mar 19, 2015 at 5:39 PM, Arnaldo Carvalho de Melo <arnaldo.melo@gmail.com> wrote:
> >> > > On Mar 19, 2015 9:34 PM, "Stephane Eranian" <eranian@google.com> wrote:
> >> > >> On Thu, Mar 19, 2015 at 3:58 PM, Arnaldo Carvalho de Melo
> >> > >> <acme@kernel.org> wrote:
> >> > >> >         This patch, together with what is in my perf/core branch, should
> >> > >> > implement that feature we talked about recently, i.e. to allow
> >> > >> > annotating entries in callchains, please take a look at see if you think
> >> > >> > it is ok,
> >
> >> > >> I tried on tip.git and a simple example. It does what I wanted.
> >> > >> I will try on more complex test cases.
> >> > >> Thanks for implementing this quickly.
> >
> >> > > Thanks for testing, please let us know if you have further suggestions,
> >
> >> > Ok, it does not work.
> >
> > Are you sure? I just tried, take a look at:
> >
> > http://vger.kernel.org/~acme/perf-report-annotate-callchain-entries-in-multiple-DSOs-in-the-same-hist_entry.png
> >
> > In there you will see that in the unmap_single_vma case there are
> > callchains that pass thru multiple DSOs in userspace (I used --call
> > dwarf in 'perf record') and those are marked as having
> > samples/annotation and when I go to those, pressing 'a' after moving the
> > cursor to it and it works as expected...
> >
> > Do you have some specific example I could try?
> >
> I tried on an example I cannot share.
> But I am guessing you could reproduce with a test which calls a libc
> or libm function
> heavily form multiple callers in the main program.
> Example:
>        -  pow()
>            50% foo() [main.c]
>            50% bar() [main.c]
>
> If I move the cursor line to foo() and annotate foo() is shows me the
> code of pow().

Did you play with acme/perf/core not tip/perf/core?  I got same
problem but then I realize it's not the Arnaldo's tree.  When I
changed to acme/perf/core the problem disappeared. :)

But unfortunately I got this segfault instead..

  namhyung@sejong:perf$ perf report
  perf: Segmentation fault
  -------- backtrace --------
  perf[0x506e5b]
  /usr/lib/libc.so.6(+0x33540)[0x7fa3eb90a540]
  perf[0x47b39c]
  perf(disasm_line__free+0x58)[0x47c178]
  perf(symbol__tui_annotate+0x2f3)[0x4fe683]
  perf[0x503773]
  perf(perf_evlist__tui_browse_hists+0x94)[0x505b44]
  perf(cmd_report+0x18f0)[0x436890]
  perf[0x47a793]
  perf(main+0x60a)[0x427c7a]
  /usr/lib/libc.so.6(__libc_start_main+0xf0)[0x7fa3eb8f7800]
  perf(_start+0x29)[0x427d99]
  [0x0]

  namhyung@sejong:perf$ addr2line -e `which perf` 0x506e5b
  /home/namhyung/project/linux/tools/perf/ui/tui/setup.c:106
  namhyung@sejong:perf$ addr2line -e `which perf` 0x47b39c
  /home/namhyung/project/linux/tools/perf/util/annotate.c:33

Thanks,
Namhyung

^ permalink raw reply	[flat|nested] 14+ messages in thread
* Re: [RFC PATCH] perf tui: Annotate entries in callchains
  2015-03-23  0:27             ` Namhyung Kim
@ 2015-03-23 16:49               ` Stephane Eranian
  2015-03-23 16:56                 ` Arnaldo Carvalho de Melo
  0 siblings, 1 reply; 14+ messages in thread
From: Stephane Eranian @ 2015-03-23 16:49 UTC (permalink / raw)
  To: Namhyung Kim
  Cc: Arnaldo Carvalho de Melo, Linux Kernel Mailing List, Jiri Olsa,
	Peter Zijlstra, Frederic Weisbecker, linux-perf-users,
	David Ahern, Ingo Molnar

On Sun, Mar 22, 2015 at 5:27 PM, Namhyung Kim <namhyung@kernel.org> wrote:
> Hi Stephane,
>
> On Fri, Mar 20, 2015 at 02:12:30PM -0700, Stephane Eranian wrote:
>> On Fri, Mar 20, 2015 at 2:07 PM, Arnaldo Carvalho de Melo
>> <arnaldo.melo@gmail.com> wrote:
>> > Em Fri, Mar 20, 2015 at 05:39:22PM -0300, Arnaldo Carvalho de Melo escreveu:
>> >> Em Fri, Mar 20, 2015 at 10:15:53AM -0700, Stephane Eranian escreveu:
>> >> > On Thu, Mar 19, 2015 at 5:39 PM, Arnaldo Carvalho de Melo <arnaldo.melo@gmail.com> wrote:
>> >> > > On Mar 19, 2015 9:34 PM, "Stephane Eranian" <eranian@google.com> wrote:
>> >> > >> On Thu, Mar 19, 2015 at 3:58 PM, Arnaldo Carvalho de Melo
>> >> > >> <acme@kernel.org> wrote:
>> >> > >> >         This patch, together with what is in my perf/core branch, should
>> >> > >> > implement that feature we talked about recently, i.e. to allow
>> >> > >> > annotating entries in callchains, please take a look at see if you think
>> >> > >> > it is ok,
>> >
>> >> > >> I tried on tip.git and a simple example. It does what I wanted.
>> >> > >> I will try on more complex test cases.
>> >> > >> Thanks for implementing this quickly.
>> >
>> >> > > Thanks for testing, please let us know if you have further suggestions,
>> >
>> >> > Ok, it does not work.
>> >
>> > Are you sure? I just tried, take a look at:
>> >
>> > http://vger.kernel.org/~acme/perf-report-annotate-callchain-entries-in-multiple-DSOs-in-the-same-hist_entry.png
>> >
>> > In there you will see that in the unmap_single_vma case there are
>> > callchains that pass thru multiple DSOs in userspace (I used --call
>> > dwarf in 'perf record') and those are marked as having
>> > samples/annotation and when I go to those, pressing 'a' after moving the
>> > cursor to it and it works as expected...
>> >
>> > Do you have some specific example I could try?
>> >
>> I tried on an example I cannot share.
>> But I am guessing you could reproduce with a test which calls a libc
>> or libm function
>> heavily form multiple callers in the main program.
>> Example:
>>        -  pow()
>>            50% foo() [main.c]
>>            50% bar() [main.c]
>>
>> If I move the cursor line to foo() and annotate foo() is shows me the
>> code of pow().
>
> Did you play with acme/perf/core not tip/perf/core?  I got same
> problem but then I realize it's not the Arnaldo's tree.  When I
> changed to acme/perf/core the problem disappeared. :)
>
I was only trying it with tip.git. The patch looke simple enough to apply
to tip.git but clearly it relies on some other infrastructure changes which
I don't know about. In my case =, I care about getting this feature in tip.git
or older versions of perf.

> But unfortunately I got this segfault instead..
>
>   namhyung@sejong:perf$ perf report
>   perf: Segmentation fault
>   -------- backtrace --------
>   perf[0x506e5b]
>   /usr/lib/libc.so.6(+0x33540)[0x7fa3eb90a540]
>   perf[0x47b39c]
>   perf(disasm_line__free+0x58)[0x47c178]
>   perf(symbol__tui_annotate+0x2f3)[0x4fe683]
>   perf[0x503773]
>   perf(perf_evlist__tui_browse_hists+0x94)[0x505b44]
>   perf(cmd_report+0x18f0)[0x436890]
>   perf[0x47a793]
>   perf(main+0x60a)[0x427c7a]
>   /usr/lib/libc.so.6(__libc_start_main+0xf0)[0x7fa3eb8f7800]
>   perf(_start+0x29)[0x427d99]
>   [0x0]
>
>   namhyung@sejong:perf$ addr2line -e `which perf` 0x506e5b
>   /home/namhyung/project/linux/tools/perf/ui/tui/setup.c:106
>   namhyung@sejong:perf$ addr2line -e `which perf` 0x47b39c
>   /home/namhyung/project/linux/tools/perf/util/annotate.c:33
>
> Thanks,
> Namhyung

^ permalink raw reply	[flat|nested] 14+ messages in thread
* Re: [RFC PATCH] perf tui: Annotate entries in callchains
  2015-03-23 16:49               ` Stephane Eranian
@ 2015-03-23 16:56                 ` Arnaldo Carvalho de Melo
  2015-03-27 23:05                   ` Stephane Eranian
  0 siblings, 1 reply; 14+ messages in thread
From: Arnaldo Carvalho de Melo @ 2015-03-23 16:56 UTC (permalink / raw)
  To: Stephane Eranian, Namhyung Kim
  Cc: Linux Kernel Mailing List, Jiri Olsa, Peter Zijlstra,
	Frederic Weisbecker, linux-perf-users, David Ahern, Ingo Molnar


Le 23 mars 2015 13:49:24 GMT-03:00, Stephane Eranian <eranian@google.com> a écrit :
>On Sun, Mar 22, 2015 at 5:27 PM, Namhyung Kim <namhyung@kernel.org>
>wrote:().
>>
>> Did you play with acme/perf/core not tip/perf/core?  I got same
>> problem but then I realize it's not the Arnaldo's tree.  When I
>> changed to acme/perf/core the problem disappeared. :)
>>
>I was only trying it with tip.git. The patch looke simple enough to
>apply
>to tip.git but clearly it relies on some other infrastructure changes
>which
>I don't know about. In my case =, I care about getting this feature in
>tip.git
>or older versions of perf.

It is all in tip.git by now.

>> But unfortunately I got this segfault instead..

Needs a patch that is in perf/urgent


-- Arnaldo

Sent from smartphone.

^ permalink raw reply	[flat|nested] 14+ messages in thread
* Re: [RFC PATCH] perf tui: Annotate entries in callchains
  2015-03-23 16:56                 ` Arnaldo Carvalho de Melo
@ 2015-03-27 23:05                   ` Stephane Eranian
  2015-03-28 16:24                     ` Arnaldo Carvalho de Melo
  0 siblings, 1 reply; 14+ messages in thread
From: Stephane Eranian @ 2015-03-27 23:05 UTC (permalink / raw)
  To: Arnaldo Carvalho de Melo
  Cc: Namhyung Kim, Linux Kernel Mailing List, Jiri Olsa,
	Peter Zijlstra, Frederic Weisbecker, linux-perf-users,
	David Ahern, Ingo Molnar

On Mon, Mar 23, 2015 at 9:56 AM, Arnaldo Carvalho de Melo
<arnaldo.melo@gmail.com> wrote:
>
>
> Le 23 mars 2015 13:49:24 GMT-03:00, Stephane Eranian <eranian@google.com> a écrit :
>>On Sun, Mar 22, 2015 at 5:27 PM, Namhyung Kim <namhyung@kernel.org>
>>wrote:().
>>>
>>> Did you play with acme/perf/core not tip/perf/core?  I got same
>>> problem but then I realize it's not the Arnaldo's tree.  When I
>>> changed to acme/perf/core the problem disappeared. :)
>>>
>>I was only trying it with tip.git. The patch looke simple enough to
>>apply
>>to tip.git but clearly it relies on some other infrastructure changes
>>which
>>I don't know about. In my case =, I care about getting this feature in
>>tip.git
>>or older versions of perf.
>
> It is all in tip.git by now.
>
>>> But unfortunately I got this segfault instead..
>
> Needs a patch that is in perf/urgent
>
If I pull tip.git now. Does it have what is needed to work?

^ permalink raw reply	[flat|nested] 14+ messages in thread
* Re: [RFC PATCH] perf tui: Annotate entries in callchains
  2015-03-27 23:05                   ` Stephane Eranian
@ 2015-03-28 16:24                     ` Arnaldo Carvalho de Melo
  0 siblings, 0 replies; 14+ messages in thread
From: Arnaldo Carvalho de Melo @ 2015-03-28 16:24 UTC (permalink / raw)
  To: Stephane Eranian
  Cc: Namhyung Kim, Linux Kernel Mailing List, Jiri Olsa,
	Peter Zijlstra, Frederic Weisbecker, linux-perf-users,
	David Ahern, Ingo Molnar

Em Fri, Mar 27, 2015 at 04:05:03PM -0700, Stephane Eranian escreveu:
> On Mon, Mar 23, 2015 at 9:56 AM, Arnaldo Carvalho de Melo wrote:
> > Le 23 mars 2015 13:49:24 GMT-03:00, Stephane Eranian <eranian@google.com> a écrit :
> >>On Sun, Mar 22, 2015 at 5:27 PM, Namhyung Kim <namhyung@kernel.org>
> >>> Did you play with acme/perf/core not tip/perf/core?  I got same
> >>> problem but then I realize it's not the Arnaldo's tree.  When I
> >>> changed to acme/perf/core the problem disappeared. :)

> >>I was only trying it with tip.git. The patch looke simple enough to
> >>apply to tip.git but clearly it relies on some other infrastructure
> >>changes which I don't know about. In my case =, I care about getting
> >>this feature in tip.git or older versions of perf.

> > It is all in tip.git by now.

> >>> But unfortunately I got this segfault instead..

> > Needs a patch that is in perf/urgent

> If I pull tip.git now. Does it have what is needed to work?

Yes, it should, but you may hit the bug Namhyumg reported, fixed in:

https://git.kernel.org/cgit/linux/kernel/git/torvalds/linux.git/commit/tools/perf/util/annotate.c?id=3995614d9b0320e10ce202836c8477e1bcf1a2d4

perf annotate: Fix fallback to unparsed disassembler line

----

Humm, by tip.git you mean tip.git/master?  /me checks...

[acme@ssdandy linux]$ git log --oneline tip/master
tools/perf/util/annotate.c | head -5
571564babaa3 Merge branch 'perf/core'
2c7da8c590ad perf annotate: Allow annotation for decompressed kernel modules    <------------------
3995614d9b03 perf annotate: Fix fallback to unparsed disassembler line
48000a1aed74 perf tools: Remove EOL whitespaces
0fb9f2aab738 perf annotate: Fix memory leaks in LOCK handling
[acme@ssdandy linux]$

Yeah, it is there, should have everything you need.

- Arnaldo

^ permalink raw reply	[flat|nested] 14+ messages in thread
end of thread, other threads:[~2015-03-28 16:24 UTC | newest]

Thread overview: 14+ messages (download: mbox.gz follow: Atom feed
-- links below jump to the message on this page --
2015-03-19 22:58 [RFC PATCH] perf tui: Annotate entries in callchains Arnaldo Carvalho de Melo
2015-03-20  0:34 ` Stephane Eranian
     [not found]   ` <CA+JHD93s2VkkdJMKZOGa6fPwEd43C8Ow80CU0b=bwTV=_8zjhw@mail.gmail.com>
2015-03-20 17:15     ` Stephane Eranian
2015-03-20 17:21       ` Arnaldo Carvalho de Melo
2015-03-20 20:39       ` Arnaldo Carvalho de Melo
2015-03-20 21:07         ` Arnaldo Carvalho de Melo
2015-03-20 21:12           ` Stephane Eranian
2015-03-20 21:34             ` Arnaldo Carvalho de Melo
2015-03-20 21:45               ` Arnaldo Carvalho de Melo
2015-03-23  0:27             ` Namhyung Kim
2015-03-23 16:49               ` Stephane Eranian
2015-03-23 16:56                 ` Arnaldo Carvalho de Melo
2015-03-27 23:05                   ` Stephane Eranian
2015-03-28 16:24                     ` Arnaldo Carvalho de Melo
This is a public inbox, see mirroring instructions
for how to clone and mirror all data and code used for this inbox;
as well as URLs for NNTP newsgroup(s).