* callchain sampling bug in perf?
@ 2010-08-15 22:53 Christoph Hellwig
  2010-08-19  0:57 ` Frederic Weisbecker
  0 siblings, 1 reply; 13+ messages in thread
From: Christoph Hellwig @ 2010-08-15 22:53 UTC (permalink / raw)
  To: acme; +Cc: linux-kernel

I'm trying to play with perf record -g, that is sampling the callchains.
Doing this with simple workloads works fine, but when I try to do this
with compilebench a lot of samples seem to get lost.

I'm doing the following:

perf probe --add xlog_sync
perf record -g -e probe:xlog_sync -- ./compilebench

Trying to report it I do not get any callchains at all:

[root@virtlab106 compilebench-0.6]# perf report -g flat -n
# Events: 9K cycles
#
# Overhead  Samples         Command      Shared Object     Symbol
# ........ ..........  ............  .................  .........
#
    70.41%       6757  compilebench  [kernel.kallsyms]  [k] xlog_sync
    22.61%       2170          sync  [kernel.kallsyms]  [k] xlog_sync
     3.89%        373            sh  [kernel.kallsyms]  [k] xlog_sync
     2.50%        240        python  [kernel.kallsyms]  [k] xlog_sync
     0.33%         32         :3881  [kernel.kallsyms]  [k] xlog_sync
     0.13%         12         :3971  [kernel.kallsyms]  [k] xlog_sync
     0.11%         11         :3956  [kernel.kallsyms]  [k] xlog_sync
     0.01%          1         :3972  [kernel.kallsyms]  [k] xlog_sync

Doing a perf report -g flat,0.0 -n shows lots of callgraph, but the
percentag for them doesn't add up at all.


^ permalink raw reply	[flat|nested] 13+ messages in thread
* Re: callchain sampling bug in perf? 2010-08-15 22:53 callchain sampling bug in perf? Christoph Hellwig @ 2010-08-19 0:57 ` Frederic Weisbecker [not found] ` <20100819085700.GB8782@infradead.org> 0 siblings, 1 reply; 13+ messages in thread From: Frederic Weisbecker @ 2010-08-19 0:57 UTC (permalink / raw) To: Christoph Hellwig; +Cc: acme, linux-kernel, Ingo Molnar, Peter Zijlstra On Sun, Aug 15, 2010 at 06:53:59PM -0400, Christoph Hellwig wrote: > I'm trying to play with perf record -g, that is sampling the callchains. > Doing this with simple workloads works fine, but when I try to do this > with compilebench a lot of samples seem to get lost. > > I'm doing the following: > > perf probe --add xlog_sync > perf record -g -e probe:xlog_sync -- ./compilebench > > Trying to report it I do not get any callchains at all: > > [root@virtlab106 compilebench-0.6]# perf report -g flat -n > # Events: 9K cycles > # > # Overhead Samples Command Shared Object Symbol > # ........ .......... ............ ................. ......... > # > 70.41% 6757 compilebench [kernel.kallsyms] [k] xlog_sync > 22.61% 2170 sync [kernel.kallsyms] [k] xlog_sync > 3.89% 373 sh [kernel.kallsyms] [k] xlog_sync > 2.50% 240 python [kernel.kallsyms] [k] xlog_sync > 0.33% 32 :3881 [kernel.kallsyms] [k] xlog_sync > 0.13% 12 :3971 [kernel.kallsyms] [k] xlog_sync > 0.11% 11 :3956 [kernel.kallsyms] [k] xlog_sync > 0.01% 1 :3972 [kernel.kallsyms] [k] xlog_sync > > Doing a perf report -g flat,0.0 -n shows lots of callgraph, but the > percentag for them doesn't add up at all. Hmm, against which tree are you running? I've just tested callchains record on random kprobe based tracepoint and it seemed to work well on report. Could you send me your perf.data and also the resulting archive after the following command: "perf archive" ? Thanks. ^ permalink raw reply [flat|nested] 13+ messages in thread
[parent not found: <20100819085700.GB8782@infradead.org>]
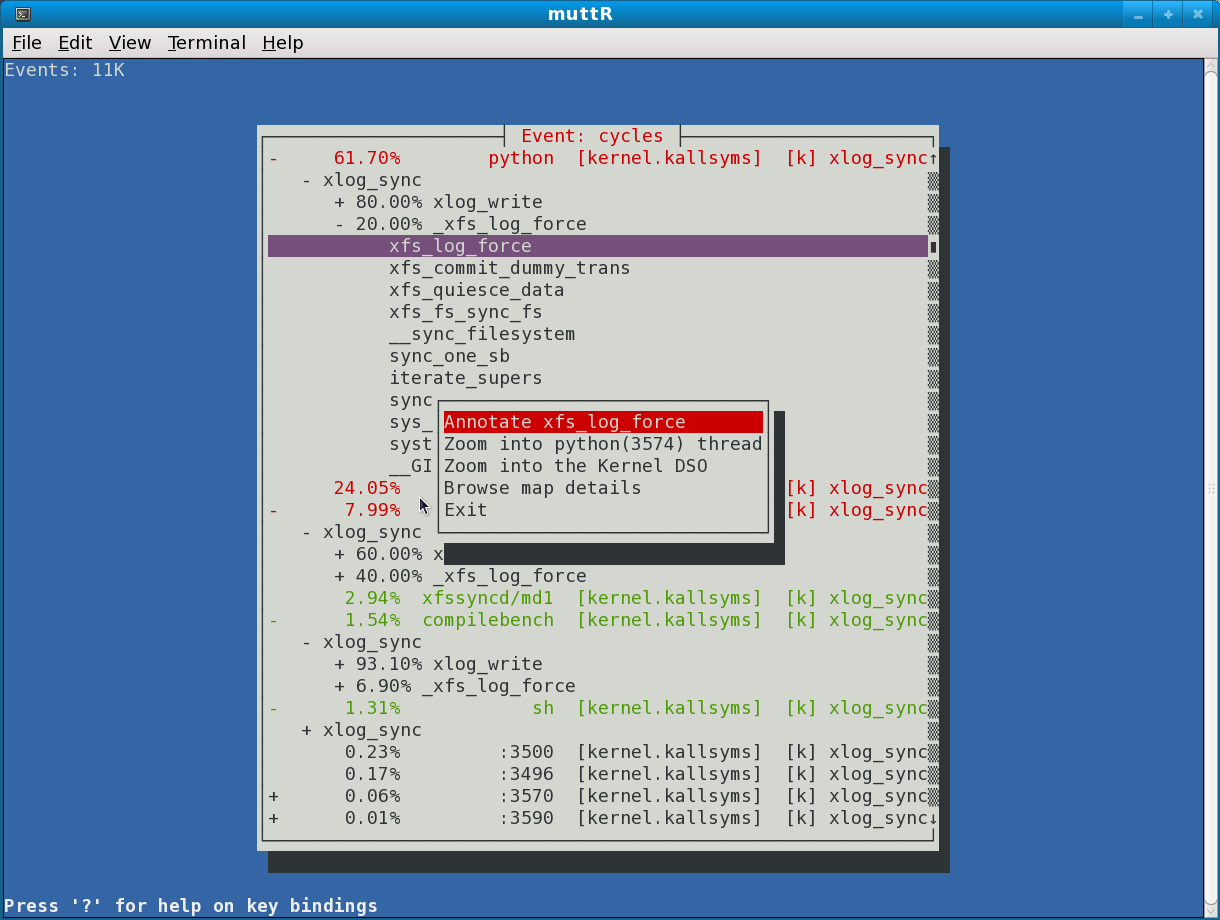
* Re: callchain sampling bug in perf?
       [not found]   ` <20100819085700.GB8782@infradead.org>
@ 2010-08-19 15:04     ` Arnaldo Carvalho de Melo
  2010-08-20  9:16       ` Christoph Hellwig
  0 siblings, 1 reply; 13+ messages in thread
From: Arnaldo Carvalho de Melo @ 2010-08-19 15:04 UTC (permalink / raw)
  To: Christoph Hellwig
  Cc: Frederic Weisbecker, linux-kernel, Ingo Molnar, Peter Zijlstra

Em Thu, Aug 19, 2010 at 04:57:01AM -0400, Christoph Hellwig escreveu:
> On Thu, Aug 19, 2010 at 02:57:22AM +0200, Frederic Weisbecker wrote:
> > Hmm, against which tree are you running? I've just tested callchains
> > record on random kprobe based tracepoint and it seemed to work well
> > on report.
>
> It's 2.6.36-rc1 + a few filesystem related changes.
>
> > Could you send me your perf.data and also the resulting archive
> > after the following command: "perf archive" ?
>
> Both attached.

[acme@doppio tmp]$ tar xvf perf.data.tar.bz2 -C ~/.debug
.build-id/36/4300f12afee3dd5b1a87269d60de586f6b61ce
[kernel.kallsyms]/364300f12afee3dd5b1a87269d60de586f6b61ce
[acme@doppio tmp]$
[acme@doppio tmp]$ cat /home/acme/.perfconfig
[tui]

	report=off
[acme@doppio tmp]$ perf report
# Events: 11K cycles
#
# Overhead       Command      Shared Object     Symbol
# ........  ............  .................  .........
#
    61.70%        python  [kernel.kallsyms]  [k] xlog_sync
    24.05%     flush-9:1  [kernel.kallsyms]  [k] xlog_sync
     7.99%          sync  [kernel.kallsyms]  [k] xlog_sync
     2.94%  xfssyncd/md1  [kernel.kallsyms]  [k] xlog_sync
     1.54%  compilebench  [kernel.kallsyms]  [k] xlog_sync
     1.31%            sh  [kernel.kallsyms]  [k] xlog_sync
     0.23%         :3500  [kernel.kallsyms]  [k] xlog_sync
     0.17%         :3496  [kernel.kallsyms]  [k] xlog_sync
     0.06%         :3570  [kernel.kallsyms]  [k] xlog_sync
     0.01%         :3590  [kernel.kallsyms]  [k] xlog_sync


#
# (For a higher level overview, try: perf report --sort comm,dso)
#
[acme@doppio tmp]$

# yeah, I need to do what we discussed and make tui activation on the command
# line, this use case proves it, if it needed proving usefulness at all :-)

[acme@doppio tmp]$ cat /home/acme/.perfconfig
[tui]

	report=on

[acme@doppio tmp]$ perf report

http://vger.kernel.org/~acme/perf/perf-report-tui-callchain-xlog_sync.png

So it seems to work (you tell me if the callchains make sense), and the problem
is just on the stdio based callchain rendering.

Frederic, so it doesn't look like anything in the kernel, just a tools/perf/
problem.

I found some issues on the TUI as well, please press the left key some times
after expanding some callchains, so that the window can be resized, your workload
has just a few top level entries, so the window initially is small, I need to
take into account the (to be expanded) callchains and size it properly.

- Arnaldo

^ permalink raw reply	[flat|nested] 13+ messages in thread
* Re: callchain sampling bug in perf?
  2010-08-19 15:04     ` Arnaldo Carvalho de Melo
@ 2010-08-20  9:16       ` Christoph Hellwig
  2010-08-20 19:12         ` Arnaldo Carvalho de Melo
  2010-08-21  2:47         ` Frederic Weisbecker
  0 siblings, 2 replies; 13+ messages in thread
From: Christoph Hellwig @ 2010-08-20  9:16 UTC (permalink / raw)
  To: Arnaldo Carvalho de Melo
  Cc: Christoph Hellwig, Frederic Weisbecker, linux-kernel, Ingo Molnar,
	Peter Zijlstra

On Thu, Aug 19, 2010 at 12:04:22PM -0300, Arnaldo Carvalho de Melo wrote:
>
> [acme@doppio tmp]$ perf report
>
> http://vger.kernel.org/~acme/perf/perf-report-tui-callchain-xlog_sync.png
>
> So it seems to work (you tell me if the callchains make sense), and the problem

I've rebuilt perf with libnewt to reproduce it, but to get any of the
callchain data I need to call perf report with a -g argument (which is
rather expected from the documentation anyway)

I still see the same problems as with the TUI perf report with that.
With the -g {mode},0.0 there is nothing to expand inside the GUI for
e.g. the pythong process, and with the 0.0 threshold I can only expand
a few 0.<something> callchains, but I never see the 80% your screenshot
shows.  What perf version are you running?

Also the flat mode is rendered incorrectly, it just adds different call
graphs inside a single process directly after each other instead of
separating them in the rendering.


^ permalink raw reply	[flat|nested] 13+ messages in thread
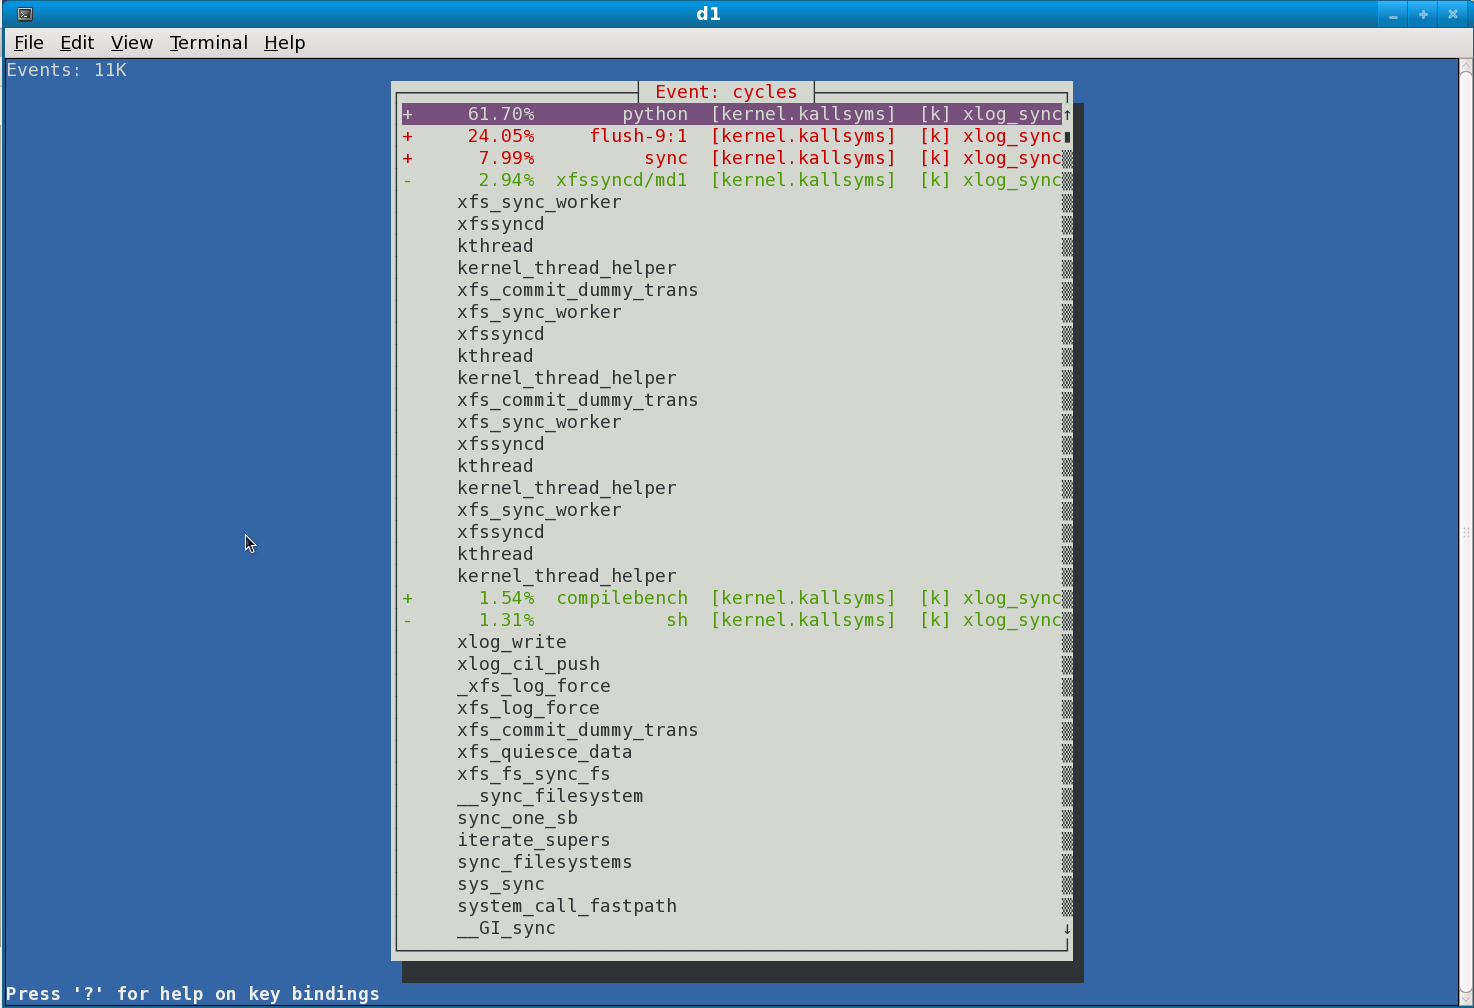
* Re: callchain sampling bug in perf?
  2010-08-20  9:16       ` Christoph Hellwig
@ 2010-08-20 19:12         ` Arnaldo Carvalho de Melo
  2010-08-21  2:29           ` Frederic Weisbecker
  2010-08-21 14:44           ` Christoph Hellwig
  2010-08-21  2:47         ` Frederic Weisbecker
  1 sibling, 2 replies; 13+ messages in thread
From: Arnaldo Carvalho de Melo @ 2010-08-20 19:12 UTC (permalink / raw)
  To: Christoph Hellwig
  Cc: Frederic Weisbecker, linux-kernel, Ingo Molnar, Peter Zijlstra

Em Fri, Aug 20, 2010 at 05:16:45AM -0400, Christoph Hellwig escreveu:
> On Thu, Aug 19, 2010 at 12:04:22PM -0300, Arnaldo Carvalho de Melo wrote:
> >
> > [acme@doppio tmp]$ perf report
> >
> > http://vger.kernel.org/~acme/perf/perf-report-tui-callchain-xlog_sync.png
> >
> > So it seems to work (you tell me if the callchains make sense), and the problem
>
> I've rebuilt perf with libnewt to reproduce it, but to get any of the
> callchain data I need to call perf report with a -g argument (which is
> rather expected from the documentation anyway)

In fact I never run 'perf report' specifying '-g', have you tried it
that way?

> I still see the same problems as with the TUI perf report with that.
> With the -g {mode},0.0 there is nothing to expand inside the GUI for
> e.g. the pythong process, and with the 0.0 threshold I can only expand
> a few 0.<something> callchains, but I never see the 80% your screenshot
> shows.  What perf version are you running?

IIRC I tried this on perf/urgent and on perf/core, the former should be what
is Linus tree.

Lemme try again, right, just checked out from torvalds/master and running it
as:

$ perf report

that screenshot is reproduced.

> Also the flat mode is rendered incorrectly, it just adds different call
> graphs inside a single process directly after each other instead of
> separating them in the rendering.

Probably because of what I said above, i.e. I still have to try 'perf
record -g flat' on the TUI, lets see...

Running it as:

$ perf report -g flat,0,0

This is produced:

http://vger.kernel.org/~acme/perf/perf-report-tui-g-flat.png

which has the flat percentages missing, have to fix that but hey, at least I
finally tried it! 8-)

The TUI code started with the default:

[acme@doppio linux-2.6-tip]$ perf report --help
<SNIP>
       -g [type,min], --call-graph
           Display callchains using type and min percent threshold. type can
           be either:

           ·   flat: single column, linear exposure of callchains.

           ·   graph: use a graph tree, displaying absolute overhead rates.

           ·   fractal: like graph, but displays relative rates. Each branch
               of the tree is considered as a new profiled object. Default:
                                                                   ^^^^^^^^
               fractal,0.5.
               ^^^^^^^^^^^
<SNIP>

The TUI took longer than I antecipated to get right, requiring writing a
generic tree widget from scratch, not using any libnewt code, as the one newt
has is too cumbersome and inflexible to use :-\

I will work to have the "flat" and "graph" modes working properly in the coming
weeks.

It should work on the stdio mode, IIRC Frédéric told me he found and fixed the
problem there, right?

- Arnaldo

^ permalink raw reply	[flat|nested] 13+ messages in thread
* Re: callchain sampling bug in perf?
  2010-08-20 19:12         ` Arnaldo Carvalho de Melo
@ 2010-08-21  2:29           ` Frederic Weisbecker
  2010-08-21 14:44           ` Christoph Hellwig
  1 sibling, 0 replies; 13+ messages in thread
From: Frederic Weisbecker @ 2010-08-21  2:29 UTC (permalink / raw)
  To: Arnaldo Carvalho de Melo
  Cc: Christoph Hellwig, linux-kernel, Ingo Molnar, Peter Zijlstra

On Fri, Aug 20, 2010 at 04:12:30PM -0300, Arnaldo Carvalho de Melo wrote:
> Em Fri, Aug 20, 2010 at 05:16:45AM -0400, Christoph Hellwig escreveu:
> > On Thu, Aug 19, 2010 at 12:04:22PM -0300, Arnaldo Carvalho de Melo wrote:
> > >
> > > [acme@doppio tmp]$ perf report
> > >
> > > http://vger.kernel.org/~acme/perf/perf-report-tui-callchain-xlog_sync.png
> > >
> > > So it seems to work (you tell me if the callchains make sense), and the problem
> >
> > I've rebuilt perf with libnewt to reproduce it, but to get any of the
> > callchain data I need to call perf report with a -g argument (which is
> > rather expected from the documentation anyway)
>
> In fact I never run 'perf report' specifying '-g', have you tried it
> that way?
>
> > I still see the same problems as with the TUI perf report with that.
> > With the -g {mode},0.0 there is nothing to expand inside the GUI for
> > e.g. the pythong process, and with the 0.0 threshold I can only expand
> > a few 0.<something> callchains, but I never see the 80% your screenshot
> > shows.  What perf version are you running?
>
> IIRC I tried this on perf/urgent and on perf/core, the former should be what
> is Linus tree.
>
> Lemme try again, right, just checked out from torvalds/master and running it
> as:
>
> $ perf report
>
> that screenshot is reproduced.
>
> > Also the flat mode is rendered incorrectly, it just adds different call
> > graphs inside a single process directly after each other instead of
> > separating them in the rendering.
>
> Probably because of what I said above, i.e. I still have to try 'perf
> record -g flat' on the TUI, lets see...
>
> Running it as:
>
> $ perf report -g flat,0,0
>
> This is produced:
>
> http://vger.kernel.org/~acme/perf/perf-report-tui-g-flat.png
>
> which has the flat percentages missing, have to fix that but hey, at least I
> finally tried it! 8-)
>
> The TUI code started with the default:
>
> [acme@doppio linux-2.6-tip]$ perf report --help
> <SNIP>
>        -g [type,min], --call-graph
>            Display callchains using type and min percent threshold. type can
>            be either:
>
>            ·   flat: single column, linear exposure of callchains.
>
>            ·   graph: use a graph tree, displaying absolute overhead rates.
>
>            ·   fractal: like graph, but displays relative rates. Each branch
>                of the tree is considered as a new profiled object. Default:
>                                                                    ^^^^^^^^
>                fractal,0.5.
>                ^^^^^^^^^^^
> <SNIP>
>
> The TUI took longer than I antecipated to get right, requiring writing a
> generic tree widget from scratch, not using any libnewt code, as the one newt
> has is too cumbersome and inflexible to use :-\
>
> I will work to have the "flat" and "graph" modes working properly in the coming
> weeks.


I think graph mode is nice to have in the TUI.
Actually this should be called "absolute fractal", as opposite to default
mode that "relative fractal".

In "graph" mode we show the overhead percentage against the total overhead, while
in default mode "fractal" we show overhead against the parent branch.

But the flat mode is just a dumb dump of every callchain records. It's mostly
useful for callchain debugging I think. May be it's not worth adapting the TUI
for that mode. As you want.

One day I really need to fill the perf wiki about callchains.


> It should work on the stdio mode, IIRC Frédéric told me he found and fixed the
> problem there, right?


Part of it. I've a fix for the "nothing displayed unless 0 min percentage" case.
Now I need to investigate on why callchains percentages sometimes don't add up correctly.

Those are eventually two different problems (more details in my next reply to Christoph).

Thanks.


^ permalink raw reply	[flat|nested] 13+ messages in thread
* Re: callchain sampling bug in perf?
  2010-08-20 19:12         ` Arnaldo Carvalho de Melo
  2010-08-21  2:29           ` Frederic Weisbecker
@ 2010-08-21 14:44           ` Christoph Hellwig
  1 sibling, 0 replies; 13+ messages in thread
From: Christoph Hellwig @ 2010-08-21 14:44 UTC (permalink / raw)
  To: Arnaldo Carvalho de Melo
  Cc: Christoph Hellwig, Frederic Weisbecker, linux-kernel, Ingo Molnar,
	Peter Zijlstra

On Fri, Aug 20, 2010 at 04:12:30PM -0300, Arnaldo Carvalho de Melo wrote:
> In fact I never run 'perf report' specifying '-g', have you tried it
> that way?

Yes, same issue.

> It should work on the stdio mode, IIRC Fr?d?ric told me he found and fixed the
> problem there, right?

With the patch some modes work, but not all.

And I'm getting really eager to get separate commands for TUI with line
mode perf report.  Having to recompile the damn thing all the time or
tweak config files (which is even worse) is getting highly annoying.


^ permalink raw reply	[flat|nested] 13+ messages in thread
* Re: callchain sampling bug in perf?
  2010-08-20  9:16       ` Christoph Hellwig
  2010-08-20 19:12         ` Arnaldo Carvalho de Melo
@ 2010-08-21  2:47         ` Frederic Weisbecker
  2010-08-21 14:42           ` Christoph Hellwig
  1 sibling, 1 reply; 13+ messages in thread
From: Frederic Weisbecker @ 2010-08-21  2:47 UTC (permalink / raw)
  To: Christoph Hellwig
  Cc: Arnaldo Carvalho de Melo, linux-kernel, Ingo Molnar,
	Peter Zijlstra

On Fri, Aug 20, 2010 at 05:16:45AM -0400, Christoph Hellwig wrote:
> On Thu, Aug 19, 2010 at 12:04:22PM -0300, Arnaldo Carvalho de Melo wrote:
> >
> > [acme@doppio tmp]$ perf report
> >
> > http://vger.kernel.org/~acme/perf/perf-report-tui-callchain-xlog_sync.png
> >
> > So it seems to work (you tell me if the callchains make sense), and the problem
>
> I've rebuilt perf with libnewt to reproduce it, but to get any of the
> callchain data I need to call perf report with a -g argument (which is
> rather expected from the documentation anyway)
>
> I still see the same problems as with the TUI perf report with that.
> With the -g {mode},0.0 there is nothing to expand inside the GUI for
  ^^
  you meant "without", right?

> e.g. the pythong process, and with the 0.0 threshold I can only expand
> a few 0.<something> callchains, but I never see the 80% your screenshot
> shows.  What perf version are you running?


Right. So this is due to the roots of the callchains that have uninitialized
values for their children hits.

To summarize, you enter a percentage (or you keep the default 0.5%) and it gets
multiplied by a random number. The result is supposed to be the minimum hits
a branch should have to be displayed. But it often produced a huge number due
to the unintialization randomness. Hence some callchains were not displayed.

The following patch solves that particular problem, I'll push it to Ingo for .36
(and -stable):

diff --git a/tools/perf/util/callchain.h b/tools/perf/util/callchain.h
index 624a96c..d1349d0 100644
--- a/tools/perf/util/callchain.h
+++ b/tools/perf/util/callchain.h
@@ -51,6 +51,7 @@ static inline void callchain_init(struct callchain_node *node)
 	INIT_LIST_HEAD(&node->val);

 	node->parent = NULL;
+	node->children_hit = 0;
 	node->hit = 0;
 }


> Also the flat mode is rendered incorrectly, it just adds different call
> graphs inside a single process directly after each other instead of
> separating them in the rendering.


I'm not sure what you mean. The flat format is a pure dump of every callchains
that belong to a single process (or whatever kind of histogram source...).

What do you mean by separating them in the rendering?

OTOH I see another bug:

    61.70%        python  [kernel.kallsyms]  [k] xlog_sync
             0.03%
                xlog_sync
                xlog_write
                xlog_cil_push
                _xfs_log_force
                xfs_log_force
                xfs_commit_dummy_trans
                xfs_quiesce_data
                xfs_fs_sync_fs
                __sync_filesystem
                sync_one_sb
                iterate_supers
                sync_filesystems
                sys_sync
                system_call_fastpath
                0x334f0d72e7

             0.01%
                xlog_sync
                _xfs_log_force
                xfs_log_force
                xfs_commit_dummy_trans
                xfs_quiesce_data
                xfs_fs_sync_fs
                __sync_filesystem
                sync_one_sb
                iterate_supers
                sync_filesystems
                sys_sync
                system_call_fastpath
                0x334f0d72e7

I think that's what you said previously: they sometimes don't add up correctly.
The total of hit percentages from callchains should equal the total
percentage of the process they belong to.

I'm investigating to find the reason.

Thanks a lot of your reports!


^ permalink raw reply related	[flat|nested] 13+ messages in thread
* Re: callchain sampling bug in perf?
  2010-08-21  2:47         ` Frederic Weisbecker
@ 2010-08-21 14:42           ` Christoph Hellwig
  2010-08-21 14:46             ` Christoph Hellwig
  2010-08-22  0:49             ` Frederic Weisbecker
  0 siblings, 2 replies; 13+ messages in thread
From: Christoph Hellwig @ 2010-08-21 14:42 UTC (permalink / raw)
  To: Frederic Weisbecker
  Cc: Christoph Hellwig, Arnaldo Carvalho de Melo, linux-kernel,
	Ingo Molnar, Peter Zijlstra

On Sat, Aug 21, 2010 at 04:47:14AM +0200, Frederic Weisbecker wrote:
> > I still see the same problems as with the TUI perf report with that.
> > With the -g {mode},0.0 there is nothing to expand inside the GUI for
>   ^^
>   you meant "without", right?

Yes, sorry.

> The following patch solves that particular problem, I'll push it to Ingo for .36
> (and -stable):

It does seem to fix the bug for some cases but not all.  Default perf
report in TUI and the normal command line seem to get it right.  perf
report -g flat still shows the old problem.  perf report -g flat,0.0
shows callgraphs, but just as before they just show the 0.<n>
percentages.

Btw, even in normal perf report mode the numbers while they look correct
confused me a bit.  The percentages before the callgraphs split are
always relative to the node above, not absolute which is rather
confusing.  And even despite adding -n to the perf report command line
I only get absolute numbers for the proccesses but not the actual
callgraphs.

> > Also the flat mode is rendered incorrectly, it just adds different call
> > graphs inside a single process directly after each other instead of
> > separating them in the rendering.
>
>
> I'm not sure what you mean. The flat format is a pure dump of every callchains
> that belong to a single process (or whatever kind of histogram source...).
>
> What do you mean by separating them in the rendering?

If there are different callchains leading to the same tracepoint they
are just appened to each other with no visual indication that they are
separate callchains


^ permalink raw reply	[flat|nested] 13+ messages in thread
* Re: callchain sampling bug in perf?
  2010-08-21 14:42           ` Christoph Hellwig
@ 2010-08-21 14:46             ` Christoph Hellwig
  2010-08-22  5:20               ` Frederic Weisbecker
  2010-08-22  0:49             ` Frederic Weisbecker
  1 sibling, 1 reply; 13+ messages in thread
From: Christoph Hellwig @ 2010-08-21 14:46 UTC (permalink / raw)
  To: Frederic Weisbecker
  Cc: Christoph Hellwig, Arnaldo Carvalho de Melo, linux-kernel,
	Ingo Molnar, Peter Zijlstra

On Sat, Aug 21, 2010 at 10:42:39AM -0400, Christoph Hellwig wrote:
> It does seem to fix the bug for some cases but not all.  Default perf
> report in TUI and the normal command line seem to get it right.  perf
> report -g flat still shows the old problem.  perf report -g flat,0.0
> shows callgraphs, but just as before they just show the 0.<n>
> percentages.

-g graph also shows the same issue of not beeing able to expand the
python line.  It seems like only the fractal case was fixed by that
patch.


^ permalink raw reply	[flat|nested] 13+ messages in thread
* Re: callchain sampling bug in perf?
  2010-08-21 14:46             ` Christoph Hellwig
@ 2010-08-22  5:20               ` Frederic Weisbecker
  2010-08-22  8:11                 ` Christoph Hellwig
  0 siblings, 1 reply; 13+ messages in thread
From: Frederic Weisbecker @ 2010-08-22  5:20 UTC (permalink / raw)
  To: Christoph Hellwig
  Cc: Arnaldo Carvalho de Melo, linux-kernel, Ingo Molnar,
	Peter Zijlstra

[-- Attachment #1: Type: text/plain, Size: 808 bytes --]

On Sat, Aug 21, 2010 at 10:46:25AM -0400, Christoph Hellwig wrote:
> On Sat, Aug 21, 2010 at 10:42:39AM -0400, Christoph Hellwig wrote:
> > It does seem to fix the bug for some cases but not all.  Default perf
> > report in TUI and the normal command line seem to get it right.  perf
> > report -g flat still shows the old problem.  perf report -g flat,0.0
> > shows callgraphs, but just as before they just show the 0.<n>
> > percentages.
>
> -g graph also shows the same issue of not beeing able to expand the
> python line.  It seems like only the fractal case was fixed by that
> patch.
>


Now does it work with the patch in attachment?
It includes the previous one.

It still needs a few cleanups but the idea is there.
Ah and it applies in tip:perf/core but latest -linus
should be fine.

Thanks.


[-- Attachment #2: callchain.diff --]
[-- Type: text/x-diff, Size: 2957 bytes --]

diff --git a/tools/perf/util/callchain.c b/tools/perf/util/callchain.c
index f231f43..e0b5183 100644
--- a/tools/perf/util/callchain.c
+++ b/tools/perf/util/callchain.c
@@ -379,7 +379,6 @@ static void filter_context(struct ip_callchain *old, struct resolved_chain *new,
 	new->nr = j;
 }

-
 int append_chain(struct callchain_node *root, struct ip_callchain *chain,
 		 struct map_symbol *syms, u64 period)
 {
@@ -404,3 +403,71 @@ end:

 	return 0;
 }
+
+static int
+merge_chain_branch(struct callchain_node *dst, struct callchain_node *src,
+		   struct ip_callchain *chain, struct map_symbol *syms)
+{
+	struct callchain_node *child;
+	struct callchain_list *list;
+	int old_pos = chain->nr;
+	int err = 0;
+
+	list_for_each_entry(list, &src->val, list) {
+		if (chain->nr == 4096) {
+			err = -ENOSPC;
+			goto out;
+		}
+
+		chain->ips[chain->nr] = list->ip;
+		syms[chain->nr] = list->ms;
+		chain->nr++;
+	}
+
+	if (src->hit)
+		err = append_chain(dst, chain, syms, src->hit);
+
+	if (!err) {
+		chain_for_each_child(child, src) {
+			err = merge_chain_branch(dst, child, chain, syms);
+			if (err)
+				break;
+		}
+	}
+
+out:
+	chain->nr = old_pos;
+
+	return err;
+}
+
+int merge_chain(struct callchain_node *dst, struct callchain_node *src)
+{
+	struct callchain_node *child;
+	struct ip_callchain *chain;
+	struct map_symbol *syms;
+	int err = 0;
+
+	chain = malloc(sizeof(*chain) + 4096 * sizeof(u64));
+	if (!chain)
+		return -ENOMEM;
+
+	chain->nr = 0;
+
+	syms = malloc(sizeof(*syms) * 4096);
+	if (!syms) {
+		free(chain);
+		return -ENOMEM;
+	}
+
+	chain_for_each_child(child, src) {
+		err = merge_chain_branch(dst, child, chain, syms);
+		if (err)
+			break;
+	}
+
+	free(chain);
+	free(syms);
+
+	return err;
+}
diff --git a/tools/perf/util/callchain.h b/tools/perf/util/callchain.h
index 624a96c..da5cd09 100644
--- a/tools/perf/util/callchain.h
+++ b/tools/perf/util/callchain.h
@@ -50,6 +50,7 @@ static inline void callchain_init(struct callchain_node *node)
 	INIT_LIST_HEAD(&node->children);
 	INIT_LIST_HEAD(&node->val);

+	node->children_hit = 0;
 	node->parent = NULL;
 	node->hit = 0;
 }
@@ -62,6 +63,7 @@ static inline u64 cumul_hits(struct callchain_node *node)
 int register_callchain_param(struct callchain_param *param);
 int append_chain(struct callchain_node *root, struct ip_callchain *chain,
 		 struct map_symbol *syms, u64 period);
+int merge_chain(struct callchain_node *dst, struct callchain_node *src);

 bool ip_callchain__valid(struct ip_callchain *chain, const event_t *event);
 #endif	/* __PERF_CALLCHAIN_H */
diff --git a/tools/perf/util/hist.c b/tools/perf/util/hist.c
index be22ae6..5ba3de7 100644
--- a/tools/perf/util/hist.c
+++ b/tools/perf/util/hist.c
@@ -226,6 +226,7 @@ static bool collapse__insert_entry(struct rb_root *root, struct hist_entry *he)

 		if (!cmp) {
 			iter->period += he->period;
+			merge_chain(iter->callchain, he->callchain);
 			hist_entry__free(he);
 			return false;
 		}

^ permalink raw reply related	[flat|nested] 13+ messages in thread
* Re: callchain sampling bug in perf?
  2010-08-22  5:20               ` Frederic Weisbecker
@ 2010-08-22  8:11                 ` Christoph Hellwig
  0 siblings, 0 replies; 13+ messages in thread
From: Christoph Hellwig @ 2010-08-22  8:11 UTC (permalink / raw)
  To: Frederic Weisbecker
  Cc: Christoph Hellwig, Arnaldo Carvalho de Melo, linux-kernel,
	Ingo Molnar, Peter Zijlstra

On Sun, Aug 22, 2010 at 07:20:14AM +0200, Frederic Weisbecker wrote:
> Now does it work with the patch in attachment?
> It includes the previous one.

It works perfectly thanks!


^ permalink raw reply	[flat|nested] 13+ messages in thread
* Re: callchain sampling bug in perf?
  2010-08-21 14:42           ` Christoph Hellwig
  2010-08-21 14:46             ` Christoph Hellwig
@ 2010-08-22  0:49             ` Frederic Weisbecker
  1 sibling, 0 replies; 13+ messages in thread
From: Frederic Weisbecker @ 2010-08-22  0:49 UTC (permalink / raw)
  To: Christoph Hellwig
  Cc: Arnaldo Carvalho de Melo, linux-kernel, Ingo Molnar,
	Peter Zijlstra

On Sat, Aug 21, 2010 at 10:42:39AM -0400, Christoph Hellwig wrote:
> It does seem to fix the bug for some cases but not all.  Default perf
> report in TUI and the normal command line seem to get it right.  perf
> report -g flat still shows the old problem.  perf report -g flat,0.0
> shows callgraphs, but just as before they just show the 0.<n>
> percentages.


Yep. So I just found the other problem.
We collect every events and store them into per tid histograms.
But depending on the final sorting (by default we sort by comm),
we may merge (collapse) the histograms against the sorting
criteria. If this is by comm, per tid histograms will become
per comm histograms, hence threads profiles will into process
profiles. We have callbacks that handle this merge, but we
forgot to handle callchains.

So imagine we have three threads (tids: 1000, 1001, 1002) that
belong to python.

tid 1000 got 100 events
tid 1001 got 10 events
tid 1002 got 3 events


Once we merge these histograms to get a per comm result, we'll
finally get:

python got 113 events

The problem is we merge 1000 and 1001 histograms into 1002. So the end
merge result, wrt callchains, will be only 1002 callchains. Because
we haven't handled callchains in the merge. Only those from one of
the threads survived.


So, I'm going to fix that.


> Btw, even in normal perf report mode the numbers while they look correct
> confused me a bit.  The percentages before the callgraphs split are
> always relative to the node above, not absolute which is rather
> confusing.  And even despite adding -n to the perf report command line
> I only get absolute numbers for the proccesses but not the actual
> callgraphs.


That's the point of the fractal mode. It's a relative profiling against
the parent node.

But you can select the "graph" mode that does an absolute profiling (against
the total hits).


> > > Also the flat mode is rendered incorrectly, it just adds different call
> > > graphs inside a single process directly after each other instead of
> > > separating them in the rendering.
> >
> >
> > I'm not sure what you mean. The flat format is a pure dump of every callchains
> > that belong to a single process (or whatever kind of histogram source...).
> >
> > What do you mean by separating them in the rendering?
>
> If there are different callchains leading to the same tracepoint they
> are just appened to each other with no visual indication that they are
> separate callchains


Ah right. There is a blank line between callchains. If that's confusing I
can add a kind of "----" boundary.

Thanks.


^ permalink raw reply	[flat|nested] 13+ messages in thread
end of thread, other threads:[~2010-08-22  8:12 UTC | newest]

Thread overview: 13+ messages (download: mbox.gz follow: Atom feed
-- links below jump to the message on this page --
2010-08-15 22:53 callchain sampling bug in perf? Christoph Hellwig
2010-08-19  0:57 ` Frederic Weisbecker
     [not found]   ` <20100819085700.GB8782@infradead.org>
2010-08-19 15:04     ` Arnaldo Carvalho de Melo
2010-08-20  9:16       ` Christoph Hellwig
2010-08-20 19:12         ` Arnaldo Carvalho de Melo
2010-08-21  2:29           ` Frederic Weisbecker
2010-08-21 14:44           ` Christoph Hellwig
2010-08-21  2:47         ` Frederic Weisbecker
2010-08-21 14:42           ` Christoph Hellwig
2010-08-21 14:46             ` Christoph Hellwig
2010-08-22  5:20               ` Frederic Weisbecker
2010-08-22  8:11                 ` Christoph Hellwig
2010-08-22  0:49             ` Frederic Weisbecker
This is a public inbox, see mirroring instructions
for how to clone and mirror all data and code used for this inbox;
as well as URLs for NNTP newsgroup(s).