* Re: System CPU increasing on idle 2.6.36
       [not found] ` <20101218010801.GE28367@hostway.ca>
@ 2010-12-29 22:03   ` Simon Kirby
       [not found]     ` <AANLkTinq074Q-B=5B4_aXuBm-3ELwGknsJv+OvS1z1OX@mail.gmail.com>
  0 siblings, 1 reply; 16+ messages in thread
From: Simon Kirby @ 2010-12-29 22:03 UTC (permalink / raw)
  To: linux-nfs; +Cc: linux-kernel

On Fri, Dec 17, 2010 at 05:08:01PM -0800, Simon Kirby wrote:

> On Wed, Dec 08, 2010 at 01:25:05PM -0800, Simon Kirby wrote:
>
> > Possibly related to the flush-processes-taking-CPU issues I saw
> > previously, I thought this was interesting.  I found a log-crunching box
> > that does all of its work via NFS and spends most of the day sleeping.
> > It has been using a linearly-increasing amount of system time during the
> > time where is sleeping.  munin graph:
> >
> > http://0x.ca/sim/ref/2.6.36/cpu_logcrunch_nfs.png
> >...
> > Known 2.6.36 issue?  This did not occur on 2.6.35.4, according to the
> > munin graphs.  I'll try 2.6.37-rc an see if it changes.
>
> So, back on this topic,
>
> It seems that system CPU from "flush" processes is still increasing
> during and after periods of NFS activity, even with 2.6.37-rc5-git4:
>
>         http://0x.ca/sim/ref/2.6.37/cpu_nfs.png
>
> Something is definitely going on while NFS is active, and then keeps
> happening in the idle periods.  top and perf top look the same as in
> 2.6.36.  No userland activity at all, but the kernel keeps doing stuff.
>
> I could bisect this, but I have to wait a day for each build, unless I
> can come up with a way to reproduce it more quickly.  The mount points
> for which the flush processes are active are the two mount points where
> the logs are read from, rotated, compressed, and unlinked, and where the
> reports are written, running in parallel under an xargs -P 15.
>
> I'm pretty sure the only syscalls that are reproducing this are read(),
> readdir(), lstat(), write(), rename(), unlink(), and close().  There's
> nothing special happening here...

I've noticed nfs_inode_cache is ever-increasing as well with 2.6.37:

  OBJS ACTIVE  USE OBJ SIZE  SLABS OBJ/SLAB CACHE SIZE NAME
2562514 2541520  99%    0.95K  78739       33   2519648K nfs_inode_cache
467200 285110  61%    0.02K   1825      256      7300K kmalloc-16
299397 242350  80%    0.19K  14257       21     57028K dentry
217434 131978  60%    0.55K   7767       28    124272K radix_tree_node
215232  81522  37%    0.06K   3363       64     13452K kmalloc-64
183027 136802  74%    0.10K   4693       39     18772K buffer_head
101120  71184  70%    0.03K    790      128      3160K kmalloc-32
 79616  59713  75%    0.12K   2488       32      9952K kmalloc-128
 66560  41257  61%    0.01K    130      512       520K kmalloc-8
 42126  26650  63%    0.75K   2006       21     32096K ext3_inode_cache

http://0x.ca/sim/ref/2.6.37/inodes_nfs.png
http://0x.ca/sim/ref/2.6.37/cpu2_nfs.png

Perhaps I could bisect just fs/nfs changes between 2.6.35 and 2.6.36 to
try to track this down without having to wait too long, unless somebody
can see what is happening here.

Simon-

^ permalink raw reply	[flat|nested] 16+ messages in thread
[parent not found: <AANLkTinq074Q-B=5B4_aXuBm-3ELwGknsJv+OvS1z1OX@mail.gmail.com>]
* Re: System CPU increasing on idle 2.6.36
       [not found]     ` <AANLkTinq074Q-B=5B4_aXuBm-3ELwGknsJv+OvS1z1OX@mail.gmail.com>
@ 2011-01-04 21:40       ` Simon Kirby
  2011-01-05 19:43         ` Mark Moseley
  0 siblings, 1 reply; 16+ messages in thread
From: Simon Kirby @ 2011-01-04 21:40 UTC (permalink / raw)
  To: Mark Moseley; +Cc: linux-nfs, linux-kernel

On Tue, Jan 04, 2011 at 09:42:14AM -0800, Mark Moseley wrote:

> On Wed, Dec 29, 2010 at 2:03 PM, Simon Kirby <sim@hostway.ca> wrote:
>
> > I've noticed nfs_inode_cache is ever-increasing as well with 2.6.37:
> >
> > ?OBJS ACTIVE ?USE OBJ SIZE ?SLABS OBJ/SLAB CACHE SIZE NAME
> > 2562514 2541520 ?99% ? ?0.95K ?78739 ? ? ? 33 ? 2519648K nfs_inode_cache
> > 467200 285110 ?61% ? ?0.02K ? 1825 ? ? ?256 ? ? ?7300K kmalloc-16
> > 299397 242350 ?80% ? ?0.19K ?14257 ? ? ? 21 ? ? 57028K dentry
> > 217434 131978 ?60% ? ?0.55K ? 7767 ? ? ? 28 ? ?124272K radix_tree_node
> > 215232 ?81522 ?37% ? ?0.06K ? 3363 ? ? ? 64 ? ? 13452K kmalloc-64
> > 183027 136802 ?74% ? ?0.10K ? 4693 ? ? ? 39 ? ? 18772K buffer_head
> > 101120 ?71184 ?70% ? ?0.03K ? ?790 ? ? ?128 ? ? ?3160K kmalloc-32
> > ?79616 ?59713 ?75% ? ?0.12K ? 2488 ? ? ? 32 ? ? ?9952K kmalloc-128
> > ?66560 ?41257 ?61% ? ?0.01K ? ?130 ? ? ?512 ? ? ? 520K kmalloc-8
> > ?42126 ?26650 ?63% ? ?0.75K ? 2006 ? ? ? 21 ? ? 32096K ext3_inode_cache
> >
> > http://0x.ca/sim/ref/2.6.37/inodes_nfs.png
> > http://0x.ca/sim/ref/2.6.37/cpu2_nfs.png
> >
> > Perhaps I could bisect just fs/nfs changes between 2.6.35 and 2.6.36 to
> > try to track this down without having to wait too long, unless somebody
> > can see what is happening here.
>
> I'll get started bisecting too, since this is something of a
> show-stopper. Boxes that pre-2.6.36 would stay up for months at a time
> now have to be powercycled every couple of days (which is about how
> long it takes for this behavior to show up). This is across-the-board
> for about 50 boxes, ranging from 2.6.36 to 2.6.36.2.
>
> Simon: It's probably irrelevant since these are kernel threads, but
> I'm curious what distro your boxes are running. Ours are Debian Lenny,
> i386, Dell Poweredge 850s. Just trying to figure out any
> commonalities. I'll get my boxes back on 2.6.36.2 and start watching
> nfs_inode_cache as well.

Same distro, x86_64, similar servers.

I'm not sure if the two cases I am seeing are exactly the same problem,
but on the log crunching boxes, system time seems proportional to
nfs_inode_cache and nfs_inode_cache just keeps growing forever; however,
if I stop the load and unmount the NFS mount points, all of the
nfs_inode_cache objects do actually go away (after umount finishes).

It seems the shrinker callback might not be working as intended here.

On the shared server case, the crazy spinlock contention from all of the
flusher processes happens suddenly and overloads the boxes for 10-15
minutes, and then everything recovers.  Over 21 of these boxes, they
each have about 500k-700k nfs_inode_cache objects.  The log cruncher hit
3.3 million nfs_inode_cache objects before I unmounted.

Are your boxes repeating this behaviour at any predictable interval?

Simon-

^ permalink raw reply	[flat|nested] 16+ messages in thread
* Re: System CPU increasing on idle 2.6.36
  2011-01-04 21:40       ` Simon Kirby
@ 2011-01-05 19:43         ` Mark Moseley
  2011-01-07 18:05           ` Mark Moseley
  0 siblings, 1 reply; 16+ messages in thread
From: Mark Moseley @ 2011-01-05 19:43 UTC (permalink / raw)
  To: Simon Kirby; +Cc: linux-nfs, linux-kernel

On Tue, Jan 4, 2011 at 1:40 PM, Simon Kirby <sim@hostway.ca> wrote:
> On Tue, Jan 04, 2011 at 09:42:14AM -0800, Mark Moseley wrote:
>
>> On Wed, Dec 29, 2010 at 2:03 PM, Simon Kirby <sim@hostway.ca> wrote:
>>
>> > I've noticed nfs_inode_cache is ever-increasing as well with 2.6.37:
>> >
>> > ?OBJS ACTIVE ?USE OBJ SIZE ?SLABS OBJ/SLAB CACHE SIZE NAME
>> > 2562514 2541520 ?99% ? ?0.95K ?78739 ? ? ? 33 ? 2519648K nfs_inode_cache
>> > 467200 285110 ?61% ? ?0.02K ? 1825 ? ? ?256 ? ? ?7300K kmalloc-16
>> > 299397 242350 ?80% ? ?0.19K ?14257 ? ? ? 21 ? ? 57028K dentry
>> > 217434 131978 ?60% ? ?0.55K ? 7767 ? ? ? 28 ? ?124272K radix_tree_node
>> > 215232 ?81522 ?37% ? ?0.06K ? 3363 ? ? ? 64 ? ? 13452K kmalloc-64
>> > 183027 136802 ?74% ? ?0.10K ? 4693 ? ? ? 39 ? ? 18772K buffer_head
>> > 101120 ?71184 ?70% ? ?0.03K ? ?790 ? ? ?128 ? ? ?3160K kmalloc-32
>> > ?79616 ?59713 ?75% ? ?0.12K ? 2488 ? ? ? 32 ? ? ?9952K kmalloc-128
>> > ?66560 ?41257 ?61% ? ?0.01K ? ?130 ? ? ?512 ? ? ? 520K kmalloc-8
>> > ?42126 ?26650 ?63% ? ?0.75K ? 2006 ? ? ? 21 ? ? 32096K ext3_inode_cache
>> >
>> > http://0x.ca/sim/ref/2.6.37/inodes_nfs.png
>> > http://0x.ca/sim/ref/2.6.37/cpu2_nfs.png
>> >
>> > Perhaps I could bisect just fs/nfs changes between 2.6.35 and 2.6.36 to
>> > try to track this down without having to wait too long, unless somebody
>> > can see what is happening here.
>>
>> I'll get started bisecting too, since this is something of a
>> show-stopper. Boxes that pre-2.6.36 would stay up for months at a time
>> now have to be powercycled every couple of days (which is about how
>> long it takes for this behavior to show up). This is across-the-board
>> for about 50 boxes, ranging from 2.6.36 to 2.6.36.2.
>>
>> Simon: It's probably irrelevant since these are kernel threads, but
>> I'm curious what distro your boxes are running. Ours are Debian Lenny,
>> i386, Dell Poweredge 850s. Just trying to figure out any
>> commonalities. I'll get my boxes back on 2.6.36.2 and start watching
>> nfs_inode_cache as well.
>
> Same distro, x86_64, similar servers.
>
> I'm not sure if the two cases I am seeing are exactly the same problem,
> but on the log crunching boxes, system time seems proportional to
> nfs_inode_cache and nfs_inode_cache just keeps growing forever; however,
> if I stop the load and unmount the NFS mount points, all of the
> nfs_inode_cache objects do actually go away (after umount finishes).
>
> It seems the shrinker callback might not be working as intended here.
>
> On the shared server case, the crazy spinlock contention from all of the
> flusher processes happens suddenly and overloads the boxes for 10-15
> minutes, and then everything recovers.  Over 21 of these boxes, they
> each have about 500k-700k nfs_inode_cache objects.  The log cruncher hit
> 3.3 million nfs_inode_cache objects before I unmounted.
>
> Are your boxes repeating this behaviour at any predictable interval?

Simon:
My boxes definitely fall into the latter category, with spinlock
regularly sitting at 60-80% CPU (according to 'perf top'). As far as
predictability, not strictly, but it's typically after an uptime of
2-3 days. They take so long to get into this state that I've never
seen the actual transition in person, just the after-effects of
flush-0:xx gone crazy. These boxes have a number of other NFS mounts,
but it's on the flush-0:xx's for the heavily written-to NFS mounts
that are spinning wildly, which you'd expect to be the case. The
infrequently written-to NFS servers' flush-0:xx isn't to be found in
'top' output.

I'd booted into older kernels after my initial reply, so I'm 14 hrs
into booting a box back into 2.6.36.2 and another box into a
double-bisected 2.6.35-2.6.36 kernel (my first bisect hit compile
errors). Both are running normally but that fits with the pattern so
far.

NFS Guys:
Anything else we can be digging up to help debug this? This is a
pretty ugly issue.

^ permalink raw reply	[flat|nested] 16+ messages in thread
* Re: System CPU increasing on idle 2.6.36
  2011-01-05 19:43         ` Mark Moseley
@ 2011-01-07 18:05           ` Mark Moseley
  2011-01-07 18:12             ` Mark Moseley
  2011-01-08  0:52             ` Simon Kirby
  0 siblings, 2 replies; 16+ messages in thread
From: Mark Moseley @ 2011-01-07 18:05 UTC (permalink / raw)
  To: Simon Kirby; +Cc: linux-nfs, linux-kernel

On Wed, Jan 5, 2011 at 11:43 AM, Mark Moseley <moseleymark@gmail.com> wrote:
> On Tue, Jan 4, 2011 at 1:40 PM, Simon Kirby <sim@hostway.ca> wrote:
>> On Tue, Jan 04, 2011 at 09:42:14AM -0800, Mark Moseley wrote:
>>
>>> On Wed, Dec 29, 2010 at 2:03 PM, Simon Kirby <sim@hostway.ca> wrote:
>>>
>>> > I've noticed nfs_inode_cache is ever-increasing as well with 2.6.37:
>>> >
>>> > ?OBJS ACTIVE ?USE OBJ SIZE ?SLABS OBJ/SLAB CACHE SIZE NAME
>>> > 2562514 2541520 ?99% ? ?0.95K ?78739 ? ? ? 33 ? 2519648K nfs_inode_cache
>>> > 467200 285110 ?61% ? ?0.02K ? 1825 ? ? ?256 ? ? ?7300K kmalloc-16
>>> > 299397 242350 ?80% ? ?0.19K ?14257 ? ? ? 21 ? ? 57028K dentry
>>> > 217434 131978 ?60% ? ?0.55K ? 7767 ? ? ? 28 ? ?124272K radix_tree_node
>>> > 215232 ?81522 ?37% ? ?0.06K ? 3363 ? ? ? 64 ? ? 13452K kmalloc-64
>>> > 183027 136802 ?74% ? ?0.10K ? 4693 ? ? ? 39 ? ? 18772K buffer_head
>>> > 101120 ?71184 ?70% ? ?0.03K ? ?790 ? ? ?128 ? ? ?3160K kmalloc-32
>>> > ?79616 ?59713 ?75% ? ?0.12K ? 2488 ? ? ? 32 ? ? ?9952K kmalloc-128
>>> > ?66560 ?41257 ?61% ? ?0.01K ? ?130 ? ? ?512 ? ? ? 520K kmalloc-8
>>> > ?42126 ?26650 ?63% ? ?0.75K ? 2006 ? ? ? 21 ? ? 32096K ext3_inode_cache
>>> >
>>> > http://0x.ca/sim/ref/2.6.37/inodes_nfs.png
>>> > http://0x.ca/sim/ref/2.6.37/cpu2_nfs.png
>>> >
>>> > Perhaps I could bisect just fs/nfs changes between 2.6.35 and 2.6.36 to
>>> > try to track this down without having to wait too long, unless somebody
>>> > can see what is happening here.
>>>
>>> I'll get started bisecting too, since this is something of a
>>> show-stopper. Boxes that pre-2.6.36 would stay up for months at a time
>>> now have to be powercycled every couple of days (which is about how
>>> long it takes for this behavior to show up). This is across-the-board
>>> for about 50 boxes, ranging from 2.6.36 to 2.6.36.2.
>>>
>>> Simon: It's probably irrelevant since these are kernel threads, but
>>> I'm curious what distro your boxes are running. Ours are Debian Lenny,
>>> i386, Dell Poweredge 850s. Just trying to figure out any
>>> commonalities. I'll get my boxes back on 2.6.36.2 and start watching
>>> nfs_inode_cache as well.
>>
>> Same distro, x86_64, similar servers.
>>
>> I'm not sure if the two cases I am seeing are exactly the same problem,
>> but on the log crunching boxes, system time seems proportional to
>> nfs_inode_cache and nfs_inode_cache just keeps growing forever; however,
>> if I stop the load and unmount the NFS mount points, all of the
>> nfs_inode_cache objects do actually go away (after umount finishes).
>>
>> It seems the shrinker callback might not be working as intended here.
>>
>> On the shared server case, the crazy spinlock contention from all of the
>> flusher processes happens suddenly and overloads the boxes for 10-15
>> minutes, and then everything recovers.  Over 21 of these boxes, they
>> each have about 500k-700k nfs_inode_cache objects.  The log cruncher hit
>> 3.3 million nfs_inode_cache objects before I unmounted.
>>
>> Are your boxes repeating this behaviour at any predictable interval?
>
> Simon:
> My boxes definitely fall into the latter category, with spinlock
> regularly sitting at 60-80% CPU (according to 'perf top'). As far as
> predictability, not strictly, but it's typically after an uptime of
> 2-3 days. They take so long to get into this state that I've never
> seen the actual transition in person, just the after-effects of
> flush-0:xx gone crazy. These boxes have a number of other NFS mounts,
> but it's on the flush-0:xx's for the heavily written-to NFS mounts
> that are spinning wildly, which you'd expect to be the case. The
> infrequently written-to NFS servers' flush-0:xx isn't to be found in
> 'top' output.
>
> I'd booted into older kernels after my initial reply, so I'm 14 hrs
> into booting a box back into 2.6.36.2 and another box into a
> double-bisected 2.6.35-2.6.36 kernel (my first bisect hit compile
> errors). Both are running normally but that fits with the pattern so
> far.
>
> NFS Guys:
> Anything else we can be digging up to help debug this? This is a
> pretty ugly issue.
>

NOTE: NFS/Kernel guys: I've left the 2.6.36.2 box still thrashing
about in case there's something you'd like me to look at.

Ok, both my 2.6.36.2 kernel box and my 2.6.35->2.6.36 bisect box (was
bisected to ce7db282a3830f57f5b05ec48288c23a5c4d66d5 -- this is my
first time doing bisect, so I'll preemptively apologize for doing
anything silly) both went berserk within 15 mins of each other, after
an uptime of around 63 hours for 2.6.36.2 and 65 hours for the
bisected box. The 2.6.36.2 one is still running with all the various
flush-0:xx threads spinning wildly. The bisected box just keeled over
and died, but is back up now. The only kernel messages logged are just
of the "task kworker/4:1:359 blocked for more than 120 seconds"
variety, all with _raw_spin_lock_irq at the top of the stack trace.

Looking at slabinfo, specifically, this: stats=$(grep nfs_inode_cache
/proc/slabinfo | awk '{ print $2, $3 }')
the active_objs and num_objs both increase to over a million (these
boxes are delivering mail to NFS-mounted mailboxes, so that's
perfectly reasonable). On both boxes, looking at sar, things start to
go awry around 10am today EST. At that time on the 2.6.36.2 box, the
NFS numbers look like this:

Fri Jan  7 09:58:00 2011: 1079433 1079650
Fri Jan  7 09:59:00 2011: 1079632 1080300
Fri Jan  7 10:00:00 2011: 1080196 1080300
Fri Jan  7 10:01:01 2011: 1080599 1080716
Fri Jan  7 10:02:01 2011: 1081074 1081288

on the bisected, like this:

Fri Jan  7 09:59:34 2011: 1162786 1165320
Fri Jan  7 10:00:34 2011: 1163301 1165320
Fri Jan  7 10:01:34 2011: 1164369 1165450
Fri Jan  7 10:02:35 2011: 1164179 1165450
Fri Jan  7 10:03:35 2011: 1165795 1166958

When the bisected box finally died, the last numbers were:

Fri Jan  7 10:40:33 2011: 1177156 1177202
Fri Jan  7 10:42:21 2011: 1177157 1177306
Fri Jan  7 10:44:55 2011: 1177201 1177324
Fri Jan  7 10:45:55 2011: 1177746 1177826

On the still-thrashing 2.6.36.2 box, the highwater mark is:

Fri Jan  7 10:23:30 2011: 1084020 1084070

and once things went awry, the active_objs started falling away and
the number_objs has stayed at 1084070. Last numbers were:

Fri Jan  7 12:19:34 2011: 826623 1084070

The bisected box had reached 1mil entries (or more significantly
1048576 entries) by y'day evening. The 2.6.36.2 box hit that by 7am
EST today. So in neither case was there a big spike in entries.

These boxes have identical workloads. They're not accessible from the
net, so there's no chance of a DDoS or something. The significance of
10am EST could be either uptime-related (all these have gone down
after 2-3 days) or just due to the to-be-expected early morning spike
in mail flow.

^ permalink raw reply	[flat|nested] 16+ messages in thread
* Re: System CPU increasing on idle 2.6.36
  2011-01-07 18:05           ` Mark Moseley
@ 2011-01-07 18:12             ` Mark Moseley
  2011-01-07 19:33               ` Mark Moseley
  2011-01-08  0:52             ` Simon Kirby
  1 sibling, 1 reply; 16+ messages in thread
From: Mark Moseley @ 2011-01-07 18:12 UTC (permalink / raw)
  To: Simon Kirby; +Cc: linux-nfs, linux-kernel

On Fri, Jan 7, 2011 at 10:05 AM, Mark Moseley <moseleymark@gmail.com> wrote:
> On Wed, Jan 5, 2011 at 11:43 AM, Mark Moseley <moseleymark@gmail.com> wrote:
>> On Tue, Jan 4, 2011 at 1:40 PM, Simon Kirby <sim@hostway.ca> wrote:
>>> On Tue, Jan 04, 2011 at 09:42:14AM -0800, Mark Moseley wrote:
>>>
>>>> On Wed, Dec 29, 2010 at 2:03 PM, Simon Kirby <sim@hostway.ca> wrote:
>>>>
>>>> > I've noticed nfs_inode_cache is ever-increasing as well with 2.6.37:
>>>> >
>>>> > ?OBJS ACTIVE ?USE OBJ SIZE ?SLABS OBJ/SLAB CACHE SIZE NAME
>>>> > 2562514 2541520 ?99% ? ?0.95K ?78739 ? ? ? 33 ? 2519648K nfs_inode_cache
>>>> > 467200 285110 ?61% ? ?0.02K ? 1825 ? ? ?256 ? ? ?7300K kmalloc-16
>>>> > 299397 242350 ?80% ? ?0.19K ?14257 ? ? ? 21 ? ? 57028K dentry
>>>> > 217434 131978 ?60% ? ?0.55K ? 7767 ? ? ? 28 ? ?124272K radix_tree_node
>>>> > 215232 ?81522 ?37% ? ?0.06K ? 3363 ? ? ? 64 ? ? 13452K kmalloc-64
>>>> > 183027 136802 ?74% ? ?0.10K ? 4693 ? ? ? 39 ? ? 18772K buffer_head
>>>> > 101120 ?71184 ?70% ? ?0.03K ? ?790 ? ? ?128 ? ? ?3160K kmalloc-32
>>>> > ?79616 ?59713 ?75% ? ?0.12K ? 2488 ? ? ? 32 ? ? ?9952K kmalloc-128
>>>> > ?66560 ?41257 ?61% ? ?0.01K ? ?130 ? ? ?512 ? ? ? 520K kmalloc-8
>>>> > ?42126 ?26650 ?63% ? ?0.75K ? 2006 ? ? ? 21 ? ? 32096K ext3_inode_cache
>>>> >
>>>> > http://0x.ca/sim/ref/2.6.37/inodes_nfs.png
>>>> > http://0x.ca/sim/ref/2.6.37/cpu2_nfs.png
>>>> >
>>>> > Perhaps I could bisect just fs/nfs changes between 2.6.35 and 2.6.36 to
>>>> > try to track this down without having to wait too long, unless somebody
>>>> > can see what is happening here.
>>>>
>>>> I'll get started bisecting too, since this is something of a
>>>> show-stopper. Boxes that pre-2.6.36 would stay up for months at a time
>>>> now have to be powercycled every couple of days (which is about how
>>>> long it takes for this behavior to show up). This is across-the-board
>>>> for about 50 boxes, ranging from 2.6.36 to 2.6.36.2.
>>>>
>>>> Simon: It's probably irrelevant since these are kernel threads, but
>>>> I'm curious what distro your boxes are running. Ours are Debian Lenny,
>>>> i386, Dell Poweredge 850s. Just trying to figure out any
>>>> commonalities. I'll get my boxes back on 2.6.36.2 and start watching
>>>> nfs_inode_cache as well.
>>>
>>> Same distro, x86_64, similar servers.
>>>
>>> I'm not sure if the two cases I am seeing are exactly the same problem,
>>> but on the log crunching boxes, system time seems proportional to
>>> nfs_inode_cache and nfs_inode_cache just keeps growing forever; however,
>>> if I stop the load and unmount the NFS mount points, all of the
>>> nfs_inode_cache objects do actually go away (after umount finishes).
>>>
>>> It seems the shrinker callback might not be working as intended here.
>>>
>>> On the shared server case, the crazy spinlock contention from all of the
>>> flusher processes happens suddenly and overloads the boxes for 10-15
>>> minutes, and then everything recovers.  Over 21 of these boxes, they
>>> each have about 500k-700k nfs_inode_cache objects.  The log cruncher hit
>>> 3.3 million nfs_inode_cache objects before I unmounted.
>>>
>>> Are your boxes repeating this behaviour at any predictable interval?
>>
>> Simon:
>> My boxes definitely fall into the latter category, with spinlock
>> regularly sitting at 60-80% CPU (according to 'perf top'). As far as
>> predictability, not strictly, but it's typically after an uptime of
>> 2-3 days. They take so long to get into this state that I've never
>> seen the actual transition in person, just the after-effects of
>> flush-0:xx gone crazy. These boxes have a number of other NFS mounts,
>> but it's on the flush-0:xx's for the heavily written-to NFS mounts
>> that are spinning wildly, which you'd expect to be the case. The
>> infrequently written-to NFS servers' flush-0:xx isn't to be found in
>> 'top' output.
>>
>> I'd booted into older kernels after my initial reply, so I'm 14 hrs
>> into booting a box back into 2.6.36.2 and another box into a
>> double-bisected 2.6.35-2.6.36 kernel (my first bisect hit compile
>> errors). Both are running normally but that fits with the pattern so
>> far.
>>
>> NFS Guys:
>> Anything else we can be digging up to help debug this? This is a
>> pretty ugly issue.
>>
>
> NOTE: NFS/Kernel guys: I've left the 2.6.36.2 box still thrashing
> about in case there's something you'd like me to look at.
>
> Ok, both my 2.6.36.2 kernel box and my 2.6.35->2.6.36 bisect box (was
> bisected to ce7db282a3830f57f5b05ec48288c23a5c4d66d5 -- this is my
> first time doing bisect, so I'll preemptively apologize for doing
> anything silly) both went berserk within 15 mins of each other, after
> an uptime of around 63 hours for 2.6.36.2 and 65 hours for the
> bisected box. The 2.6.36.2 one is still running with all the various
> flush-0:xx threads spinning wildly. The bisected box just keeled over
> and died, but is back up now. The only kernel messages logged are just
> of the "task kworker/4:1:359 blocked for more than 120 seconds"
> variety, all with _raw_spin_lock_irq at the top of the stack trace.
>
> Looking at slabinfo, specifically, this: stats=$(grep nfs_inode_cache
> /proc/slabinfo | awk '{ print $2, $3 }')
> the active_objs and num_objs both increase to over a million (these
> boxes are delivering mail to NFS-mounted mailboxes, so that's
> perfectly reasonable). On both boxes, looking at sar, things start to
> go awry around 10am today EST. At that time on the 2.6.36.2 box, the
> NFS numbers look like this:
>
> Fri Jan  7 09:58:00 2011: 1079433 1079650
> Fri Jan  7 09:59:00 2011: 1079632 1080300
> Fri Jan  7 10:00:00 2011: 1080196 1080300
> Fri Jan  7 10:01:01 2011: 1080599 1080716
> Fri Jan  7 10:02:01 2011: 1081074 1081288
>
> on the bisected, like this:
>
> Fri Jan  7 09:59:34 2011: 1162786 1165320
> Fri Jan  7 10:00:34 2011: 1163301 1165320
> Fri Jan  7 10:01:34 2011: 1164369 1165450
> Fri Jan  7 10:02:35 2011: 1164179 1165450
> Fri Jan  7 10:03:35 2011: 1165795 1166958
>
> When the bisected box finally died, the last numbers were:
>
> Fri Jan  7 10:40:33 2011: 1177156 1177202
> Fri Jan  7 10:42:21 2011: 1177157 1177306
> Fri Jan  7 10:44:55 2011: 1177201 1177324
> Fri Jan  7 10:45:55 2011: 1177746 1177826
>
> On the still-thrashing 2.6.36.2 box, the highwater mark is:
>
> Fri Jan  7 10:23:30 2011: 1084020 1084070
>
> and once things went awry, the active_objs started falling away and
> the number_objs has stayed at 1084070. Last numbers were:
>
> Fri Jan  7 12:19:34 2011: 826623 1084070
>
> The bisected box had reached 1mil entries (or more significantly
> 1048576 entries) by y'day evening. The 2.6.36.2 box hit that by 7am
> EST today. So in neither case was there a big spike in entries.
>
> These boxes have identical workloads. They're not accessible from the
> net, so there's no chance of a DDoS or something. The significance of
> 10am EST could be either uptime-related (all these have gone down
> after 2-3 days) or just due to the to-be-expected early morning spike
> in mail flow.
>

Actually, I shouldn't say 'perfectly reasonable'. On other boxes in
that pool, doing the same workload (but running 2.6.32.27), the number
is more like:

117196 120756

after 9 days of uptime. So maybe 8 x that  isn't quite reasonable
after only 2.5 days of uptime.

^ permalink raw reply	[flat|nested] 16+ messages in thread
* Re: System CPU increasing on idle 2.6.36
  2011-01-07 18:12             ` Mark Moseley
@ 2011-01-07 19:33               ` Mark Moseley
  0 siblings, 0 replies; 16+ messages in thread
From: Mark Moseley @ 2011-01-07 19:33 UTC (permalink / raw)
  To: Simon Kirby; +Cc: linux-nfs, linux-kernel

On Fri, Jan 7, 2011 at 10:12 AM, Mark Moseley <moseleymark@gmail.com> wrote:
> On Fri, Jan 7, 2011 at 10:05 AM, Mark Moseley <moseleymark@gmail.com> wrote:
>> On Wed, Jan 5, 2011 at 11:43 AM, Mark Moseley <moseleymark@gmail.com> wrote:
>>> On Tue, Jan 4, 2011 at 1:40 PM, Simon Kirby <sim@hostway.ca> wrote:
>>>> On Tue, Jan 04, 2011 at 09:42:14AM -0800, Mark Moseley wrote:
>>>>
>>>>> On Wed, Dec 29, 2010 at 2:03 PM, Simon Kirby <sim@hostway.ca> wrote:
>>>>>
>>>>> > I've noticed nfs_inode_cache is ever-increasing as well with 2.6.37:
>>>>> >
>>>>> > ?OBJS ACTIVE ?USE OBJ SIZE ?SLABS OBJ/SLAB CACHE SIZE NAME
>>>>> > 2562514 2541520 ?99% ? ?0.95K ?78739 ? ? ? 33 ? 2519648K nfs_inode_cache
>>>>> > 467200 285110 ?61% ? ?0.02K ? 1825 ? ? ?256 ? ? ?7300K kmalloc-16
>>>>> > 299397 242350 ?80% ? ?0.19K ?14257 ? ? ? 21 ? ? 57028K dentry
>>>>> > 217434 131978 ?60% ? ?0.55K ? 7767 ? ? ? 28 ? ?124272K radix_tree_node
>>>>> > 215232 ?81522 ?37% ? ?0.06K ? 3363 ? ? ? 64 ? ? 13452K kmalloc-64
>>>>> > 183027 136802 ?74% ? ?0.10K ? 4693 ? ? ? 39 ? ? 18772K buffer_head
>>>>> > 101120 ?71184 ?70% ? ?0.03K ? ?790 ? ? ?128 ? ? ?3160K kmalloc-32
>>>>> > ?79616 ?59713 ?75% ? ?0.12K ? 2488 ? ? ? 32 ? ? ?9952K kmalloc-128
>>>>> > ?66560 ?41257 ?61% ? ?0.01K ? ?130 ? ? ?512 ? ? ? 520K kmalloc-8
>>>>> > ?42126 ?26650 ?63% ? ?0.75K ? 2006 ? ? ? 21 ? ? 32096K ext3_inode_cache
>>>>> >
>>>>> > http://0x.ca/sim/ref/2.6.37/inodes_nfs.png
>>>>> > http://0x.ca/sim/ref/2.6.37/cpu2_nfs.png
>>>>> >
>>>>> > Perhaps I could bisect just fs/nfs changes between 2.6.35 and 2.6.36 to
>>>>> > try to track this down without having to wait too long, unless somebody
>>>>> > can see what is happening here.
>>>>>
>>>>> I'll get started bisecting too, since this is something of a
>>>>> show-stopper. Boxes that pre-2.6.36 would stay up for months at a time
>>>>> now have to be powercycled every couple of days (which is about how
>>>>> long it takes for this behavior to show up). This is across-the-board
>>>>> for about 50 boxes, ranging from 2.6.36 to 2.6.36.2.
>>>>>
>>>>> Simon: It's probably irrelevant since these are kernel threads, but
>>>>> I'm curious what distro your boxes are running. Ours are Debian Lenny,
>>>>> i386, Dell Poweredge 850s. Just trying to figure out any
>>>>> commonalities. I'll get my boxes back on 2.6.36.2 and start watching
>>>>> nfs_inode_cache as well.
>>>>
>>>> Same distro, x86_64, similar servers.
>>>>
>>>> I'm not sure if the two cases I am seeing are exactly the same problem,
>>>> but on the log crunching boxes, system time seems proportional to
>>>> nfs_inode_cache and nfs_inode_cache just keeps growing forever; however,
>>>> if I stop the load and unmount the NFS mount points, all of the
>>>> nfs_inode_cache objects do actually go away (after umount finishes).
>>>>
>>>> It seems the shrinker callback might not be working as intended here.
>>>>
>>>> On the shared server case, the crazy spinlock contention from all of the
>>>> flusher processes happens suddenly and overloads the boxes for 10-15
>>>> minutes, and then everything recovers.  Over 21 of these boxes, they
>>>> each have about 500k-700k nfs_inode_cache objects.  The log cruncher hit
>>>> 3.3 million nfs_inode_cache objects before I unmounted.
>>>>
>>>> Are your boxes repeating this behaviour at any predictable interval?
>>>
>>> Simon:
>>> My boxes definitely fall into the latter category, with spinlock
>>> regularly sitting at 60-80% CPU (according to 'perf top'). As far as
>>> predictability, not strictly, but it's typically after an uptime of
>>> 2-3 days. They take so long to get into this state that I've never
>>> seen the actual transition in person, just the after-effects of
>>> flush-0:xx gone crazy. These boxes have a number of other NFS mounts,
>>> but it's on the flush-0:xx's for the heavily written-to NFS mounts
>>> that are spinning wildly, which you'd expect to be the case. The
>>> infrequently written-to NFS servers' flush-0:xx isn't to be found in
>>> 'top' output.
>>>
>>> I'd booted into older kernels after my initial reply, so I'm 14 hrs
>>> into booting a box back into 2.6.36.2 and another box into a
>>> double-bisected 2.6.35-2.6.36 kernel (my first bisect hit compile
>>> errors). Both are running normally but that fits with the pattern so
>>> far.
>>>
>>> NFS Guys:
>>> Anything else we can be digging up to help debug this? This is a
>>> pretty ugly issue.
>>>
>>
>> NOTE: NFS/Kernel guys: I've left the 2.6.36.2 box still thrashing
>> about in case there's something you'd like me to look at.
>>
>> Ok, both my 2.6.36.2 kernel box and my 2.6.35->2.6.36 bisect box (was
>> bisected to ce7db282a3830f57f5b05ec48288c23a5c4d66d5 -- this is my
>> first time doing bisect, so I'll preemptively apologize for doing
>> anything silly) both went berserk within 15 mins of each other, after
>> an uptime of around 63 hours for 2.6.36.2 and 65 hours for the
>> bisected box. The 2.6.36.2 one is still running with all the various
>> flush-0:xx threads spinning wildly. The bisected box just keeled over
>> and died, but is back up now. The only kernel messages logged are just
>> of the "task kworker/4:1:359 blocked for more than 120 seconds"
>> variety, all with _raw_spin_lock_irq at the top of the stack trace.
>>
>> Looking at slabinfo, specifically, this: stats=$(grep nfs_inode_cache
>> /proc/slabinfo | awk '{ print $2, $3 }')
>> the active_objs and num_objs both increase to over a million (these
>> boxes are delivering mail to NFS-mounted mailboxes, so that's
>> perfectly reasonable). On both boxes, looking at sar, things start to
>> go awry around 10am today EST. At that time on the 2.6.36.2 box, the
>> NFS numbers look like this:
>>
>> Fri Jan  7 09:58:00 2011: 1079433 1079650
>> Fri Jan  7 09:59:00 2011: 1079632 1080300
>> Fri Jan  7 10:00:00 2011: 1080196 1080300
>> Fri Jan  7 10:01:01 2011: 1080599 1080716
>> Fri Jan  7 10:02:01 2011: 1081074 1081288
>>
>> on the bisected, like this:
>>
>> Fri Jan  7 09:59:34 2011: 1162786 1165320
>> Fri Jan  7 10:00:34 2011: 1163301 1165320
>> Fri Jan  7 10:01:34 2011: 1164369 1165450
>> Fri Jan  7 10:02:35 2011: 1164179 1165450
>> Fri Jan  7 10:03:35 2011: 1165795 1166958
>>
>> When the bisected box finally died, the last numbers were:
>>
>> Fri Jan  7 10:40:33 2011: 1177156 1177202
>> Fri Jan  7 10:42:21 2011: 1177157 1177306
>> Fri Jan  7 10:44:55 2011: 1177201 1177324
>> Fri Jan  7 10:45:55 2011: 1177746 1177826
>>
>> On the still-thrashing 2.6.36.2 box, the highwater mark is:
>>
>> Fri Jan  7 10:23:30 2011: 1084020 1084070
>>
>> and once things went awry, the active_objs started falling away and
>> the number_objs has stayed at 1084070. Last numbers were:
>>
>> Fri Jan  7 12:19:34 2011: 826623 1084070
>>
>> The bisected box had reached 1mil entries (or more significantly
>> 1048576 entries) by y'day evening. The 2.6.36.2 box hit that by 7am
>> EST today. So in neither case was there a big spike in entries.
>>
>> These boxes have identical workloads. They're not accessible from the
>> net, so there's no chance of a DDoS or something. The significance of
>> 10am EST could be either uptime-related (all these have gone down
>> after 2-3 days) or just due to the to-be-expected early morning spike
>> in mail flow.
>>
>
> Actually, I shouldn't say 'perfectly reasonable'. On other boxes in
> that pool, doing the same workload (but running 2.6.32.27), the number
> is more like:
>
> 117196 120756
>
> after 9 days of uptime. So maybe 8 x that  isn't quite reasonable
> after only 2.5 days of uptime.
>

On the 2.6.36.2 box, after shutting down everything else that'd touch
NFS, I let the flush threads spin for a long time with nfs and rpc
debug turned up to 65535. I also tried unmounting one of the NFS
partitions which hung for a very very long time. As they spun there
was no debug logging except the occasional thing. It eventually spit
out 197903 messages of "NFS: clear cookie (0xeadd3288/0x(nil))"
(different addresses in each line, obviously) and since then things
quieted back down. The flush-0:xx threads don't even show up in 'top'
output anymore and _raw_spin_lock in 'perf top' has gone back down to
its usual area of 3-5%.

^ permalink raw reply	[flat|nested] 16+ messages in thread
* Re: System CPU increasing on idle 2.6.36
  2011-01-07 18:05           ` Mark Moseley
  2011-01-07 18:12             ` Mark Moseley
@ 2011-01-08  0:52             ` Simon Kirby
  2011-01-08  1:30               ` Mark Moseley
  1 sibling, 1 reply; 16+ messages in thread
From: Simon Kirby @ 2011-01-08  0:52 UTC (permalink / raw)
  To: Mark Moseley; +Cc: linux-nfs, linux-kernel

On Fri, Jan 07, 2011 at 10:05:39AM -0800, Mark Moseley wrote:

> NOTE: NFS/Kernel guys: I've left the 2.6.36.2 box still thrashing
> about in case there's something you'd like me to look at.
>
> Ok, both my 2.6.36.2 kernel box and my 2.6.35->2.6.36 bisect box (was
> bisected to ce7db282a3830f57f5b05ec48288c23a5c4d66d5 -- this is my
> first time doing bisect, so I'll preemptively apologize for doing

That's a merge commit, so that doesn't sound right (it doesn't contain
changes by itself).  How were you running the bisect?  Were you
definitely seeing a good case since v2.6.35?  Could you post your
"git bisect log" so I can see if I can follow it?

> anything silly) both went berserk within 15 mins of each other, after
> an uptime of around 63 hours for 2.6.36.2 and 65 hours for the
> bisected box. The 2.6.36.2 one is still running with all the various
> flush-0:xx threads spinning wildly. The bisected box just keeled over
> and died, but is back up now. The only kernel messages logged are just
> of the "task kworker/4:1:359 blocked for more than 120 seconds"
> variety, all with _raw_spin_lock_irq at the top of the stack trace.
>
> Looking at slabinfo, specifically, this: stats=$(grep nfs_inode_cache
> /proc/slabinfo | awk '{ print $2, $3 }')
> the active_objs and num_objs both increase to over a million (these
> boxes are delivering mail to NFS-mounted mailboxes, so that's
> perfectly reasonable). On both boxes, looking at sar, things start to
> go awry around 10am today EST. At that time on the 2.6.36.2 box, the
> NFS numbers look like this:
>
> Fri Jan  7 09:58:00 2011: 1079433 1079650
> Fri Jan  7 09:59:00 2011: 1079632 1080300
> Fri Jan  7 10:00:00 2011: 1080196 1080300
> Fri Jan  7 10:01:01 2011: 1080599 1080716
> Fri Jan  7 10:02:01 2011: 1081074 1081288
>
> on the bisected, like this:
>
> Fri Jan  7 09:59:34 2011: 1162786 1165320
> Fri Jan  7 10:00:34 2011: 1163301 1165320
> Fri Jan  7 10:01:34 2011: 1164369 1165450
> Fri Jan  7 10:02:35 2011: 1164179 1165450
> Fri Jan  7 10:03:35 2011: 1165795 1166958
>
> When the bisected box finally died, the last numbers were:
>
> Fri Jan  7 10:40:33 2011: 1177156 1177202
> Fri Jan  7 10:42:21 2011: 1177157 1177306
> Fri Jan  7 10:44:55 2011: 1177201 1177324
> Fri Jan  7 10:45:55 2011: 1177746 1177826

Yeah, I was seeing load proportional to these, but I don't think their
growth is anything wrong.  It just seems to be something that is taking
up CPU from flush proceses as they grow, and something which is causing a
thundering herd of reclaim with lots of spinlock contention.

Hmmm.. I tried to see if drop_caches would clear nfs_inode_cache and thus
the CPU usage.  The top of slabtop before doing anything:

  OBJS ACTIVE  USE OBJ SIZE  SLABS OBJ/SLAB CACHE SIZE NAME
1256343 1221799  97%    0.95K  38071       33   1218272K nfs_inode_cache

# echo 2 > /proc/sys/vm/drop_caches

this took about 40 seconds to execute, and perf top showed this for
pretty much the whole time:

             samples  pcnt function                 DSO
             _______ _____ ________________________ ___________

             1188.00 45.1% _raw_spin_lock           [kernel]
              797.00 30.2% rpcauth_cache_shrinker   [kernel]
              132.00  5.0% shrink_slab              [kernel]
               60.00  2.3% queue_io                 [kernel]
               59.00  2.2% _cond_resched            [kernel]
               44.00  1.7% nfs_writepages           [kernel]
               35.00  1.3% writeback_single_inode   [kernel]
               34.00  1.3% writeback_sb_inodes      [kernel]
               23.00  0.9% do_writepages            [kernel]
               20.00  0.8% bit_waitqueue            [kernel]
               15.00  0.6% redirty_tail             [kernel]
               11.00  0.4% __iget                   [kernel]
               11.00  0.4% __GI_strstr              libc-2.7.so

slabtop then showed:

  OBJS ACTIVE  USE OBJ SIZE  SLABS OBJ/SLAB CACHE SIZE NAME
1256211 531720  42%    0.95K  38067       33   1218144K nfs_inode_cache

and this doesn't change further with drop_caches=3 or 1.  It's strange
that most of them were freed, but not all...  We do actually have
RPC_CREDCACHE_DEFAULT_HASHBITS set to 10 at build time, which might
explain a bigger credcache and time to free that.  Did you change your
auth_hashtable_size at all?  Anyway, even with all of that, system CPU
doesn't change.

Ok, weird, Running "sync" actually caused "vmstat 1" to go from 25% CPU
spikes every 5 seconds with nfs_writepages in the "perf top" every 5
seconds to being idle!  /proc/vmstat showed only nr_dirty 8 and
nr_writeback 0 before I ran "sync".  Either that, or it was just good
timing.

procs -----------memory---------- ---swap-- -----io---- -system-- ----cpu----
 r  b   swpd   free   buff  cache   si   so    bi    bo   in   cs us sy id wa
 0  0      0 6767892   9696  41088    0    0     5   180   15   70 62  7 29  1
 0  0      0 6767892   9696  41088    0    0     0     0 1124 1978  0  0 100  0
 0  0      0 6767892   9696  41088    0    0     0     0 1105 1967  0  0 100  0
 0  0      0 6767892   9696  41088    0    0     0     0 1180 1984  0  2 98  0
 2  0      0 6767892   9696  41088    0    0     0     0 2102 1968  0 22 78  0
 0  0      0 6767768   9704  41084    0    0     0    52 1504 2022  0  8 91  1
 0  0      0 6767768   9704  41084    0    0     0     0 1059 1965  0  0 100  0
 0  0      0 6767768   9704  41088    0    0     0     0 1077 1982  0  0 100  0
 0  0      0 6767768   9704  41088    0    0     0     0 1166 1972  1  2 97  0
 0  0      0 6767768   9704  41088    0    0     0     0 1353 1990  0  6 94  0
 0  0      0 6767644   9704  41100    0    0     0     0 2531 2050  0 27 72  0
 0  0      0 6767644   9704  41100    0    0     0     0 1065 1974  0  0 100  0
 1  0      0 6767644   9704  41100    0    0     0     0 1090 1967  0  0 100  0
 0  0      0 6767644   9704  41100    0    0     0     0 1175 1971  0  2 98  0
 0  0      0 6767644   9704  41100    0    0     0     0 1321 1967  0  6 94  0
 1  0      0 6767644   9712  41100    0    0     0    52 1995 1995  0 18 81  1
 0  0      0 6767644   9712  41100    0    0     0     0 1342 1964  0  6 94  0
 0  0      0 6767644   9712  41100    0    0     0     0 1064 1974  0  0 100  0
 0  0      0 6767644   9712  41100    0    0     0     0 1163 1968  0  2 98  0
 0  0      0 6767644   9712  41100    0    0     0     0 1390 1976  1  6 94  0
 0  0      0 6767768   9712  41112    0    0     0     0 1282 2018  0  1 99  0
 0  0      0 6767768   9712  41112    0    0     0     0 2166 1972  0 24 76  0
 0  0      0 6786260   9712  41112    0    0     0     0 1092 1989  0  0 100  0
 0  0      0 6786260   9712  41112    0    0     0     0 1039 2003  0  2 98  0
 0  0      0 6774588   9712  41112    0    0     0     0 1524 2015  3  9 89  0
 0  1      0 6770124   9716  41112    0    0     0    48 1315 1990  3  0 87 11
 1  0      0 6769628   9720  41112    0    0     0     4 2196 1966  0 20 79  0
 0  0      0 6768364   9724  41108    0    0    36     0 1403 2031  1  5 94  1
 0  0      0 6768388   9724  41144    0    0     0     0 1185 1969  0  2 98  0
 0  0      0 6768388   9724  41144    0    0     0     0 1351 1975  0  6 94  0
 0  0      0 6768140   9724  41156    0    0     0     0 1261 2020  0  1 99  0
 0  0      0 6768140   9724  41156    0    0     0     0 1053 1973  0  0 100  0
 1  0      0 6768140   9724  41156    0    0     0     0 2194 1971  1 26 73  0
 0  0      0 6768140   9732  41148    0    0     0    52 1283 2088  0  4 96  0
 2  0      0 6768140   9732  41156    0    0     0     0 1184 1965  0  2 98  0
 0  0      0 6786368   9732  41156    0    0     0     0 1297 2000  0  4 97  0
 0  0      0 6786384   9732  41156    0    0     0     0  998 1949  0  0 100  0
(stop vmstat 1, run sync, restart vmstat 1)
 1  0      0 6765304   9868  41736    0    0     0     0 1239 1967  0  0 100  0
 0  0      0 6765304   9868  41736    0    0     0     0 1174 2035  0  0 100  0
 0  0      0 6765304   9868  41736    0    0     0     0 1084 1976  0  0 100  0
 1  0      0 6765172   9868  41736    0    0     0     0 1100 1975  0  0 100  0
 0  0      0 6765304   9868  41760    0    0     0     0 1501 1997  1  1 98  0
 0  0      0 6765304   9868  41760    0    0     0     0 1092 1964  0  0 100  0
 1  0      0 6765304   9868  41760    0    0     0     0 1096 1963  0  0 100  0
 0  0      0 6765304   9868  41760    0    0     0     0 1083 1967  0  0 100  0
 0  0      0 6765304   9876  41752    0    0     0    76 1101 1980  0  0 99  1
 0  0      0 6765304   9876  41760    0    0     0     4 1199 2097  0  2 98  0
 0  0      0 6765304   9876  41760    0    0     0     0 1055 1964  0  0 100  0
 0  0      0 6765304   9876  41760    0    0     0     0 1064 1977  0  0 100  0
 0  0      0 6765304   9876  41760    0    0     0     0 1073 1968  0  0 100  0
 0  0      0 6765304   9876  41760    0    0     0     0 1080 1976  0  0 100  0
 0  0      0 6765156   9884  41772    0    0     0    20 1329 2034  1  1 98  1
 0  0      0 6765180   9884  41780    0    0     0     0 1097 1971  0  1 99  0
 0  0      0 6765180   9884  41780    0    0     0     0 1073 1960  0  0 100  0
 0  0      0 6765180   9884  41780    0    0     0     0 1079 1976  0  0 100  0
 0  0      0 6765172   9884  41780    0    0     0     0 1120 1980  0  0 100  0
 0  0      0 6765180   9892  41772    0    0     0    60 1097 1982  0  0 100  0
 0  0      0 6765180   9892  41780    0    0     0     0 1067 1969  0  0 100  0
 0  0      0 6765180   9892  41780    0    0     0     0 1063 1973  0  0 100  0
 0  0      0 6765180   9892  41780    0    0     0     0 1064 1969  0  1 100  0

Hmmm.  I'll watch it and see if it climbs back up again.  That would mean
that for now, echo 2 > /proc/sys/vm/drop_caches ; sync is a workaround
for the problem we're seeing with system CPU slowly creeping up since
2.6.36.  I have no idea if this affects the sudden flush process spinlock
contention and attempted writeback without much progress during normal
load, but it certainly changes things here.

http://0x.ca/sim/ref/2.6.37/cpu_after_drop_caches_2_and_sync.png

Simon-

^ permalink raw reply	[flat|nested] 16+ messages in thread
* Re: System CPU increasing on idle 2.6.36
  2011-01-08  0:52             ` Simon Kirby
@ 2011-01-08  1:30               ` Mark Moseley
  0 siblings, 0 replies; 16+ messages in thread
From: Mark Moseley @ 2011-01-08  1:30 UTC (permalink / raw)
  To: Simon Kirby; +Cc: linux-nfs, linux-kernel

On Fri, Jan 7, 2011 at 4:52 PM, Simon Kirby <sim@hostway.ca> wrote:
> On Fri, Jan 07, 2011 at 10:05:39AM -0800, Mark Moseley wrote:
>
>> NOTE: NFS/Kernel guys: I've left the 2.6.36.2 box still thrashing
>> about in case there's something you'd like me to look at.
>>
>> Ok, both my 2.6.36.2 kernel box and my 2.6.35->2.6.36 bisect box (was
>> bisected to ce7db282a3830f57f5b05ec48288c23a5c4d66d5 -- this is my
>> first time doing bisect, so I'll preemptively apologize for doing
>
> That's a merge commit, so that doesn't sound right (it doesn't contain
> changes by itself).  How were you running the bisect?  Were you
> definitely seeing a good case since v2.6.35?  Could you post your
> "git bisect log" so I can see if I can follow it?

Here's 'git bisect log':

# git bisect log
git bisect start
# bad: [f6f94e2ab1b33f0082ac22d71f66385a60d8157f] Linux 2.6.36
git bisect bad f6f94e2ab1b33f0082ac22d71f66385a60d8157f
# good: [9fe6206f400646a2322096b56c59891d530e8d51] Linux 2.6.35
git bisect good 9fe6206f400646a2322096b56c59891d530e8d51
# good: [78417334b5cb6e1f915b8fdcc4fce3f1a1b4420c] Merge branch
'bkl/core' of git://git.kernel.org/pub/scm/linux/kernel/git/frederic/random-tracing
git bisect good 78417334b5cb6e1f915b8fdcc4fce3f1a1b4420c
# good: [14a4fa20a10d76eb98b7feb25be60735217929ba] Merge branch
'for-linus' of git://git.kernel.org/pub/scm/linux/kernel/git/tiwai/sound-2.6
git bisect good 14a4fa20a10d76eb98b7feb25be60735217929ba
# bad: [ce7db282a3830f57f5b05ec48288c23a5c4d66d5] Merge branch
'for-linus' of git://git.kernel.org/pub/scm/linux/kernel/git/tj/percpu
git bisect bad ce7db282a3830f57f5b05ec48288c23a5c4d66d5

I did an initial checkout of stable
(git://git.kernel.org/pub/scm/linux/kernel/git/torvalds/linux-2.6.git)
and (after git bisect start), did a 'git bisect good v2.6.35; git
bisect bad v2.6.36' but that seemed to be way too old. I tried to
approximate 2.6.35.9->2.6.36 by doing 'git bisect good
ea8a52f9f4bcc3420c38ae07f8378a2f18443970; git bisect bad
f6f94e2ab1b33f0082ac22d71f66385a60d8157f' but that had compilation
errors so I did 'git bisect good
9fe6206f400646a2322096b56c59891d530e8d51' which compiled ok -- heh,
did I mention this was my first outing with 'git bisect' :)


> Yeah, I was seeing load proportional to these, but I don't think their
> growth is anything wrong.  It just seems to be something that is taking
> up CPU from flush proceses as they grow, and something which is causing a
> thundering herd of reclaim with lots of spinlock contention.
>
> Hmmm.. I tried to see if drop_caches would clear nfs_inode_cache and thus
> the CPU usage.  The top of slabtop before doing anything:
>
>  OBJS ACTIVE  USE OBJ SIZE  SLABS OBJ/SLAB CACHE SIZE NAME
> 1256343 1221799  97%    0.95K  38071       33   1218272K nfs_inode_cache
>
> # echo 2 > /proc/sys/vm/drop_caches
>
> this took about 40 seconds to execute, and perf top showed this for
> pretty much the whole time:
>
>             samples  pcnt function                 DSO
>             _______ _____ ________________________ ___________
>
>             1188.00 45.1% _raw_spin_lock           [kernel]
>              797.00 30.2% rpcauth_cache_shrinker   [kernel]
>              132.00  5.0% shrink_slab              [kernel]
>               60.00  2.3% queue_io                 [kernel]
>               59.00  2.2% _cond_resched            [kernel]
>               44.00  1.7% nfs_writepages           [kernel]
>               35.00  1.3% writeback_single_inode   [kernel]
>               34.00  1.3% writeback_sb_inodes      [kernel]
>               23.00  0.9% do_writepages            [kernel]
>               20.00  0.8% bit_waitqueue            [kernel]
>               15.00  0.6% redirty_tail             [kernel]
>               11.00  0.4% __iget                   [kernel]
>               11.00  0.4% __GI_strstr              libc-2.7.so
>
> slabtop then showed:
>
>  OBJS ACTIVE  USE OBJ SIZE  SLABS OBJ/SLAB CACHE SIZE NAME
> 1256211 531720  42%    0.95K  38067       33   1218144K nfs_inode_cache
>
> and this doesn't change further with drop_caches=3 or 1.  It's strange
> that most of them were freed, but not all...  We do actually have
> RPC_CREDCACHE_DEFAULT_HASHBITS set to 10 at build time, which might
> explain a bigger credcache and time to free that.  Did you change your
> auth_hashtable_size at all?  Anyway, even with all of that, system CPU
> doesn't change.

Oh, now that's interesting. I'm setting RPC_CREDCACHE_DEFAULT_HASHBITS
to 8 (and have been since Jan, so like 2.6.33 or something) -- I was
having the same issue as in this thread,
http://www.spinics.net/lists/linux-nfs/msg09261.html. Bumping up
RPC_CREDCACHE_DEFAULT_HASHBITS was like a miracle on some of our
systems. I was going to get around to switching to the 'right way' to
do that as a boot param one of these days, instead of a hack.

In the bisected kernel, I definitely did *not* touch
RPC_CREDCACHE_DEFAULT_HASHBITS and it blew up anyway. If it hadn't
completely died, it'd have been nice to see what 'perf top' said.


> Ok, weird, Running "sync" actually caused "vmstat 1" to go from 25% CPU
> spikes every 5 seconds with nfs_writepages in the "perf top" every 5
> seconds to being idle!  /proc/vmstat showed only nr_dirty 8 and
> nr_writeback 0 before I ran "sync".  Either that, or it was just good
> timing.
>
> procs -----------memory---------- ---swap-- -----io---- -system-- ----cpu----
>  r  b   swpd   free   buff  cache   si   so    bi    bo   in   cs us sy id wa
>  0  0      0 6767892   9696  41088    0    0     5   180   15   70 62  7 29  1
>  0  0      0 6767892   9696  41088    0    0     0     0 1124 1978  0  0 100  0
>  0  0      0 6767892   9696  41088    0    0     0     0 1105 1967  0  0 100  0
>  0  0      0 6767892   9696  41088    0    0     0     0 1180 1984  0  2 98  0
>  2  0      0 6767892   9696  41088    0    0     0     0 2102 1968  0 22 78  0
>  0  0      0 6767768   9704  41084    0    0     0    52 1504 2022  0  8 91  1
>  0  0      0 6767768   9704  41084    0    0     0     0 1059 1965  0  0 100  0
>  0  0      0 6767768   9704  41088    0    0     0     0 1077 1982  0  0 100  0
>  0  0      0 6767768   9704  41088    0    0     0     0 1166 1972  1  2 97  0
>  0  0      0 6767768   9704  41088    0    0     0     0 1353 1990  0  6 94  0
>  0  0      0 6767644   9704  41100    0    0     0     0 2531 2050  0 27 72  0
>  0  0      0 6767644   9704  41100    0    0     0     0 1065 1974  0  0 100  0
>  1  0      0 6767644   9704  41100    0    0     0     0 1090 1967  0  0 100  0
>  0  0      0 6767644   9704  41100    0    0     0     0 1175 1971  0  2 98  0
>  0  0      0 6767644   9704  41100    0    0     0     0 1321 1967  0  6 94  0
>  1  0      0 6767644   9712  41100    0    0     0    52 1995 1995  0 18 81  1
>  0  0      0 6767644   9712  41100    0    0     0     0 1342 1964  0  6 94  0
>  0  0      0 6767644   9712  41100    0    0     0     0 1064 1974  0  0 100  0
>  0  0      0 6767644   9712  41100    0    0     0     0 1163 1968  0  2 98  0
>  0  0      0 6767644   9712  41100    0    0     0     0 1390 1976  1  6 94  0
>  0  0      0 6767768   9712  41112    0    0     0     0 1282 2018  0  1 99  0
>  0  0      0 6767768   9712  41112    0    0     0     0 2166 1972  0 24 76  0
>  0  0      0 6786260   9712  41112    0    0     0     0 1092 1989  0  0 100  0
>  0  0      0 6786260   9712  41112    0    0     0     0 1039 2003  0  2 98  0
>  0  0      0 6774588   9712  41112    0    0     0     0 1524 2015  3  9 89  0
>  0  1      0 6770124   9716  41112    0    0     0    48 1315 1990  3  0 87 11
>  1  0      0 6769628   9720  41112    0    0     0     4 2196 1966  0 20 79  0
>  0  0      0 6768364   9724  41108    0    0    36     0 1403 2031  1  5 94  1
>  0  0      0 6768388   9724  41144    0    0     0     0 1185 1969  0  2 98  0
>  0  0      0 6768388   9724  41144    0    0     0     0 1351 1975  0  6 94  0
>  0  0      0 6768140   9724  41156    0    0     0     0 1261 2020  0  1 99  0
>  0  0      0 6768140   9724  41156    0    0     0     0 1053 1973  0  0 100  0
>  1  0      0 6768140   9724  41156    0    0     0     0 2194 1971  1 26 73  0
>  0  0      0 6768140   9732  41148    0    0     0    52 1283 2088  0  4 96  0
>  2  0      0 6768140   9732  41156    0    0     0     0 1184 1965  0  2 98  0
>  0  0      0 6786368   9732  41156    0    0     0     0 1297 2000  0  4 97  0
>  0  0      0 6786384   9732  41156    0    0     0     0  998 1949  0  0 100  0
> (stop vmstat 1, run sync, restart vmstat 1)
>  1  0      0 6765304   9868  41736    0    0     0     0 1239 1967  0  0 100  0
>  0  0      0 6765304   9868  41736    0    0     0     0 1174 2035  0  0 100  0
>  0  0      0 6765304   9868  41736    0    0     0     0 1084 1976  0  0 100  0
>  1  0      0 6765172   9868  41736    0    0     0     0 1100 1975  0  0 100  0
>  0  0      0 6765304   9868  41760    0    0     0     0 1501 1997  1  1 98  0
>  0  0      0 6765304   9868  41760    0    0     0     0 1092 1964  0  0 100  0
>  1  0      0 6765304   9868  41760    0    0     0     0 1096 1963  0  0 100  0
>  0  0      0 6765304   9868  41760    0    0     0     0 1083 1967  0  0 100  0
>  0  0      0 6765304   9876  41752    0    0     0    76 1101 1980  0  0 99  1
>  0  0      0 6765304   9876  41760    0    0     0     4 1199 2097  0  2 98  0
>  0  0      0 6765304   9876  41760    0    0     0     0 1055 1964  0  0 100  0
>  0  0      0 6765304   9876  41760    0    0     0     0 1064 1977  0  0 100  0
>  0  0      0 6765304   9876  41760    0    0     0     0 1073 1968  0  0 100  0
>  0  0      0 6765304   9876  41760    0    0     0     0 1080 1976  0  0 100  0
>  0  0      0 6765156   9884  41772    0    0     0    20 1329 2034  1  1 98  1
>  0  0      0 6765180   9884  41780    0    0     0     0 1097 1971  0  1 99  0
>  0  0      0 6765180   9884  41780    0    0     0     0 1073 1960  0  0 100  0
>  0  0      0 6765180   9884  41780    0    0     0     0 1079 1976  0  0 100  0
>  0  0      0 6765172   9884  41780    0    0     0     0 1120 1980  0  0 100  0
>  0  0      0 6765180   9892  41772    0    0     0    60 1097 1982  0  0 100  0
>  0  0      0 6765180   9892  41780    0    0     0     0 1067 1969  0  0 100  0
>  0  0      0 6765180   9892  41780    0    0     0     0 1063 1973  0  0 100  0
>  0  0      0 6765180   9892  41780    0    0     0     0 1064 1969  0  1 100  0
>
> Hmmm.  I'll watch it and see if it climbs back up again.  That would mean
> that for now, echo 2 > /proc/sys/vm/drop_caches ; sync is a workaround
> for the problem we're seeing with system CPU slowly creeping up since
> 2.6.36.  I have no idea if this affects the sudden flush process spinlock
> contention and attempted writeback without much progress during normal
> load, but it certainly changes things here.
>
> http://0x.ca/sim/ref/2.6.37/cpu_after_drop_caches_2_and_sync.png

That's pretty painful to have to do though (less painful than the box
becoming unusable, I'll admit). I wonder if when I did a umount on
mine (which must've sync'd at least that mount), it gave something a
big enough kick for the flush-0:xx threads to unstick themselves,
presumably what happened with your sync (though I didn't drop the
cache).

^ permalink raw reply	[flat|nested] 16+ messages in thread
[parent not found: <1291845189.3067.31.camel@heimdal.trondhjem.org>]
* NFS client growing system CPU
       [not found] ` <1291845189.3067.31.camel@heimdal.trondhjem.org>
@ 2011-09-27  0:39   ` Simon Kirby
  2011-09-27 11:42     ` Trond Myklebust
  0 siblings, 1 reply; 16+ messages in thread
From: Simon Kirby @ 2011-09-27  0:39 UTC (permalink / raw)
  To: Trond Myklebust; +Cc: linux-nfs, linux-kernel

Hello!

Following up on "System CPU increasing on idle 2.6.36", this issue is
still happening even on 3.1-rc7. So, since it has been 9 months since I
reported this, I figured I'd bisect this issue. The first bisection ended
in an IPMI regression that looked like the problem, so I had to start
again. Eventually, I got commit b80c3cb628f0ebc241b02e38dd028969fb8026a2
which made it into 2.6.34-rc4.

With this commit, system CPU keeps rising as the log crunch box runs
(reads log files via NFS and spews out HTML files into NFS-mounted report
directories). When it finishes the daily run, the system time stays
non-zero and continues to be higher and higher after each run, until the
box never completes a run within a day due to all of the wasted cycles.

I previously posted a munin CPU graph picture here:

http://0x.ca/sim/ref/2.6.36/cpu_logcrunch_nfs.png

Here is the most recent graph of me bisecting, roughly one day at a time:

http://0x.ca/sim/ref/2.6.34/cpu.png

Running a kernel built on this commit, I can actually make the problem
stop by just typing "sync". CPU then goes down to 0 and everything is
fine. Future kernel versions, such as 2.6.36, do not change with just a
"sync", but "sync;echo 3 > /proc/sys/vm/drop_caches;sync" _does_ stop
the system CPU usage. I can bisect this change, too, if that would help.

Here is the commit:

commit b80c3cb628f0ebc241b02e38dd028969fb8026a2
Author: Trond Myklebust <Trond.Myklebust@netapp.com>
Date:   Fri Apr 9 19:07:07 2010 -0400

    NFS: Ensure that writeback_single_inode() calls write_inode() when syncing

    Since writeback_single_inode() checks the inode->i_state flags _before_ it
    flushes out the data, we need to ensure that the I_DIRTY_DATASYNC flag is
    already set. Otherwise we risk not seeing a call to write_inode(), which
    again means that we break fsync() et al...

    Signed-off-by: Trond Myklebust <Trond.Myklebust@netapp.com>

diff --git a/fs/nfs/write.c b/fs/nfs/write.c
index 53ff70e..7f40ea3 100644
--- a/fs/nfs/write.c
+++ b/fs/nfs/write.c
@@ -421,6 +421,7 @@ static void
 nfs_mark_request_dirty(struct nfs_page *req)
 {
 	__set_page_dirty_nobuffers(req->wb_page);
+	__mark_inode_dirty(req->wb_page->mapping->host, I_DIRTY_DATASYNC);
 }

 #if defined(CONFIG_NFS_V3) || defined(CONFIG_NFS_V4)
@@ -660,6 +661,7 @@ static int nfs_writepage_setup(struct nfs_open_context *ctx, struct page *page,
 	req = nfs_setup_write_request(ctx, page, offset, count);
 	if (IS_ERR(req))
 		return PTR_ERR(req);
+	nfs_mark_request_dirty(req);
 	/* Update file length */
 	nfs_grow_file(page, offset, count);
 	nfs_mark_uptodate(page, req->wb_pgbase, req->wb_bytes);
@@ -739,8 +741,6 @@ int nfs_updatepage(struct file *file, struct page *page,
 	status = nfs_writepage_setup(ctx, page, offset, count);
 	if (status < 0)
 		nfs_set_pageerror(page);
-	else
-		__set_page_dirty_nobuffers(page);

 	dprintk("NFS:       nfs_updatepage returns %d (isize %lld)\n",
 			status, (long long)i_size_read(inode));

With the build before this commit, the system time stays low always and
returns to 0% after every daily run.

Simon-

On Wed, Dec 08, 2010 at 04:53:09PM -0500, Trond Myklebust wrote:

> On Wed, 2010-12-08 at 13:25 -0800, Simon Kirby wrote:
> > Possibly related to the flush-processes-taking-CPU issues I saw
> > previously, I thought this was interesting.  I found a log-crunching box
> > that does all of its work via NFS and spends most of the day sleeping.
> > It has been using a linearly-increasing amount of system time during the
> > time where is sleeping.  munin graph:
> >
> > http://0x.ca/sim/ref/2.6.36/cpu_logcrunch_nfs.png
> >
> > top shows:
> >
> >   PID USER      PR  NI  VIRT  RES  SHR S %CPU %MEM    TIME+  COMMAND
> >  4767 root      20   0     0    0    0 S   16  0.0   2413:29 flush-0:69
> > 22385 root      20   0     0    0    0 S   10  0.0   1320:23 flush-0:70
> > (rest idle)
> >
> > perf top shows:
> >
> > -------------------------------------------------------------------------------------------
> >    PerfTop:     252 irqs/sec  kernel:97.2%  exact:  0.0% [1000Hz cycles],  (all, 2 CPUs)
> > -------------------------------------------------------------------------------------------
> >
> >      samples  pcnt function                        DSO
> >      _______ _____ _______________________________ ___________
> >
> >       912.00 21.2% _raw_spin_lock                  [kernel]
> >       592.00 13.8% nfs_writepages                  [kernel]
> >       474.00 11.0% queue_io                        [kernel]
> >       428.00 10.0% writeback_single_inode          [kernel]
> >       379.00  8.8% writeback_sb_inodes             [kernel]
> >       237.00  5.5% bit_waitqueue                   [kernel]
> >       184.00  4.3% do_writepages                   [kernel]
> >       169.00  3.9% __iget                          [kernel]
> >       132.00  3.1% redirty_tail                    [kernel]
> >        85.00  2.0% iput                            [kernel]
> >        72.00  1.7% _atomic_dec_and_lock            [kernel]
> >        67.00  1.6% write_cache_pages               [kernel]
> >        63.00  1.5% port_inb                        [ipmi_si]
> >        62.00  1.4% __mark_inode_dirty              [kernel]
> >        48.00  1.1% __wake_up_bit                   [kernel]
> >        32.00  0.7% nfs_write_inode                 [kernel]
> >        26.00  0.6% native_read_tsc                 [kernel]
> >        25.00  0.6% radix_tree_gang_lookup_tag_slot [kernel]
> >        25.00  0.6% schedule                        [kernel]
> >        24.00  0.6% wake_up_bit                     [kernel]
> >        20.00  0.5% apic_timer_interrupt            [kernel]
> >        19.00  0.4% ia32_syscall                    [kernel]
> >        16.00  0.4% find_get_pages_tag              [kernel]
> >        15.00  0.3% _raw_spin_lock_irqsave          [kernel]
> >        15.00  0.3% load_balance                    [kernel]
> >        13.00  0.3% ktime_get                       [kernel]
> >        12.00  0.3% shrink_icache_memory            [kernel]
> >        11.00  0.3% semop                           libc-2.7.so
> > 	9.00  0.2% nfs_pageio_doio                 [kernel]
> > 	8.00  0.2% dso__find_symbol                perf
> > 	8.00  0.2% down_read                       [kernel]
> > 	7.00  0.2% __switch_to                     [kernel]
> > 	7.00  0.2% __phys_addr                     [kernel]
> > 	7.00  0.2% nfs_pageio_init                 [kernel]
> > 	7.00  0.2% pagevec_lookup_tag              [kernel]
> > 	7.00  0.2% _cond_resched                   [kernel]
> > 	7.00  0.2% up_read                         [kernel]
> > 	6.00  0.1% sched_clock_local               [kernel]
> > 	5.00  0.1% rb_erase                        [kernel]
> > 	5.00  0.1% page_fault                      [kernel]
> >
> > "tcpdump -i any -n port 2049" and "nfsstat" shows this work does not actually result
> > in any NFS packets.
> >
> > Known 2.6.36 issue?  This did not occur on 2.6.35.4, according to the
> > munin graphs.  I'll try 2.6.37-rc an see if it changes.
>
> Possibly a side effect of the fs/fs-writeback.c changes in 2.6.36? You
> do appear to be hitting a lot of spinlock contention, but I suspect that
> a lot of it is coming from writeback_sb_inodes, writeback_single_inode
> and queue_io, all of which seem unnaturally high on your stats above.
>
> I don't see how you can be seeing no traffic on the wire. You are
> certainly hitting some page writeout (0.2% nfs_pageio_doio).
>
> Cheers
>   Trond
> --
> Trond Myklebust
> Linux NFS client maintainer
>
> NetApp
> Trond.Myklebust@netapp.com
> www.netapp.com

^ permalink raw reply related	[flat|nested] 16+ messages in thread
* Re: NFS client growing system CPU
  2011-09-27  0:39   ` NFS client growing system CPU Simon Kirby
@ 2011-09-27 11:42     ` Trond Myklebust
  2011-09-27 16:49       ` Simon Kirby
  0 siblings, 1 reply; 16+ messages in thread
From: Trond Myklebust @ 2011-09-27 11:42 UTC (permalink / raw)
  To: Simon Kirby; +Cc: linux-nfs, linux-kernel

On Mon, 2011-09-26 at 17:39 -0700, Simon Kirby wrote:
> Hello!
>
> Following up on "System CPU increasing on idle 2.6.36", this issue is
> still happening even on 3.1-rc7. So, since it has been 9 months since I
> reported this, I figured I'd bisect this issue. The first bisection ended
> in an IPMI regression that looked like the problem, so I had to start
> again. Eventually, I got commit b80c3cb628f0ebc241b02e38dd028969fb8026a2
> which made it into 2.6.34-rc4.
>
> With this commit, system CPU keeps rising as the log crunch box runs
> (reads log files via NFS and spews out HTML files into NFS-mounted report
> directories). When it finishes the daily run, the system time stays
> non-zero and continues to be higher and higher after each run, until the
> box never completes a run within a day due to all of the wasted cycles.

So reverting that commit fixes the problem on 3.1-rc7?

As far as I can see, doing so should be safe thanks to commit
5547e8aac6f71505d621a612de2fca0dd988b439 (writeback: Update dirty flags
in two steps) which fixes the original problem at the VFS level.

Cheers
  Trond

--
Trond Myklebust
Linux NFS client maintainer

NetApp
Trond.Myklebust@netapp.com
www.netapp.com


^ permalink raw reply	[flat|nested] 16+ messages in thread
* Re: NFS client growing system CPU
  2011-09-27 11:42     ` Trond Myklebust
@ 2011-09-27 16:49       ` Simon Kirby
  2011-09-27 17:04         ` Trond Myklebust
  0 siblings, 1 reply; 16+ messages in thread
From: Simon Kirby @ 2011-09-27 16:49 UTC (permalink / raw)
  To: Trond Myklebust; +Cc: linux-nfs, linux-kernel

On Tue, Sep 27, 2011 at 07:42:53AM -0400, Trond Myklebust wrote:

> On Mon, 2011-09-26 at 17:39 -0700, Simon Kirby wrote:
> > Hello!
> >
> > Following up on "System CPU increasing on idle 2.6.36", this issue is
> > still happening even on 3.1-rc7. So, since it has been 9 months since I
> > reported this, I figured I'd bisect this issue. The first bisection ended
> > in an IPMI regression that looked like the problem, so I had to start
> > again. Eventually, I got commit b80c3cb628f0ebc241b02e38dd028969fb8026a2
> > which made it into 2.6.34-rc4.
> >
> > With this commit, system CPU keeps rising as the log crunch box runs
> > (reads log files via NFS and spews out HTML files into NFS-mounted report
> > directories). When it finishes the daily run, the system time stays
> > non-zero and continues to be higher and higher after each run, until the
> > box never completes a run within a day due to all of the wasted cycles.
>
> So reverting that commit fixes the problem on 3.1-rc7?
>
> As far as I can see, doing so should be safe thanks to commit
> 5547e8aac6f71505d621a612de2fca0dd988b439 (writeback: Update dirty flags
> in two steps) which fixes the original problem at the VFS level.

Hmm, I went to git revert b80c3cb628f0ebc241b02e38dd028969fb8026a2, but
for some reason git left the nfs_mark_request_dirty(req); line in
nfs_writepage_setup(), even though the original commit had that. Is that
OK or should I remove that as well?

Once that is sorted, I'll build it and let it run for a day and let you
know. Thanks!

Simon-

^ permalink raw reply	[flat|nested] 16+ messages in thread
* Re: NFS client growing system CPU
  2011-09-27 16:49       ` Simon Kirby
@ 2011-09-27 17:04         ` Trond Myklebust
  2011-09-28 19:58           ` Simon Kirby
  0 siblings, 1 reply; 16+ messages in thread
From: Trond Myklebust @ 2011-09-27 17:04 UTC (permalink / raw)
  To: Simon Kirby; +Cc: linux-nfs, linux-kernel

On Tue, 2011-09-27 at 09:49 -0700, Simon Kirby wrote:
> On Tue, Sep 27, 2011 at 07:42:53AM -0400, Trond Myklebust wrote:
>
> > On Mon, 2011-09-26 at 17:39 -0700, Simon Kirby wrote:
> > > Hello!
> > >
> > > Following up on "System CPU increasing on idle 2.6.36", this issue is
> > > still happening even on 3.1-rc7. So, since it has been 9 months since I
> > > reported this, I figured I'd bisect this issue. The first bisection ended
> > > in an IPMI regression that looked like the problem, so I had to start
> > > again. Eventually, I got commit b80c3cb628f0ebc241b02e38dd028969fb8026a2
> > > which made it into 2.6.34-rc4.
> > >
> > > With this commit, system CPU keeps rising as the log crunch box runs
> > > (reads log files via NFS and spews out HTML files into NFS-mounted report
> > > directories). When it finishes the daily run, the system time stays
> > > non-zero and continues to be higher and higher after each run, until the
> > > box never completes a run within a day due to all of the wasted cycles.
> >
> > So reverting that commit fixes the problem on 3.1-rc7?
> >
> > As far as I can see, doing so should be safe thanks to commit
> > 5547e8aac6f71505d621a612de2fca0dd988b439 (writeback: Update dirty flags
> > in two steps) which fixes the original problem at the VFS level.
>
> Hmm, I went to git revert b80c3cb628f0ebc241b02e38dd028969fb8026a2, but
> for some reason git left the nfs_mark_request_dirty(req); line in
> nfs_writepage_setup(), even though the original commit had that. Is that
> OK or should I remove that as well?
>
> Once that is sorted, I'll build it and let it run for a day and let you
> know. Thanks!

It shouldn't make any difference whether you leave it or remove it. The
resulting second call to __set_page_dirty_nobuffers() will always be a
no-op since the page will already be marked as dirty.

Cheers
  Trond
--
Trond Myklebust
Linux NFS client maintainer

NetApp
Trond.Myklebust@netapp.com
www.netapp.com


^ permalink raw reply	[flat|nested] 16+ messages in thread
* Re: NFS client growing system CPU
  2011-09-27 17:04         ` Trond Myklebust
@ 2011-09-28 19:58           ` Simon Kirby
  2011-09-30  0:58             ` Simon Kirby
  0 siblings, 1 reply; 16+ messages in thread
From: Simon Kirby @ 2011-09-28 19:58 UTC (permalink / raw)
  To: Trond Myklebust; +Cc: linux-nfs, linux-kernel

On Tue, Sep 27, 2011 at 01:04:15PM -0400, Trond Myklebust wrote:

> On Tue, 2011-09-27 at 09:49 -0700, Simon Kirby wrote:
> > On Tue, Sep 27, 2011 at 07:42:53AM -0400, Trond Myklebust wrote:
> >
> > > On Mon, 2011-09-26 at 17:39 -0700, Simon Kirby wrote:
> > > > Hello!
> > > >
> > > > Following up on "System CPU increasing on idle 2.6.36", this issue is
> > > > still happening even on 3.1-rc7. So, since it has been 9 months since I
> > > > reported this, I figured I'd bisect this issue. The first bisection ended
> > > > in an IPMI regression that looked like the problem, so I had to start
> > > > again. Eventually, I got commit b80c3cb628f0ebc241b02e38dd028969fb8026a2
> > > > which made it into 2.6.34-rc4.
> > > >
> > > > With this commit, system CPU keeps rising as the log crunch box runs
> > > > (reads log files via NFS and spews out HTML files into NFS-mounted report
> > > > directories). When it finishes the daily run, the system time stays
> > > > non-zero and continues to be higher and higher after each run, until the
> > > > box never completes a run within a day due to all of the wasted cycles.
> > >
> > > So reverting that commit fixes the problem on 3.1-rc7?
> > >
> > > As far as I can see, doing so should be safe thanks to commit
> > > 5547e8aac6f71505d621a612de2fca0dd988b439 (writeback: Update dirty flags
> > > in two steps) which fixes the original problem at the VFS level.
> >
> > Hmm, I went to git revert b80c3cb628f0ebc241b02e38dd028969fb8026a2, but
> > for some reason git left the nfs_mark_request_dirty(req); line in
> > nfs_writepage_setup(), even though the original commit had that. Is that
> > OK or should I remove that as well?
> >
> > Once that is sorted, I'll build it and let it run for a day and let you
> > know. Thanks!
>
> It shouldn't make any difference whether you leave it or remove it. The
> resulting second call to __set_page_dirty_nobuffers() will always be a
> no-op since the page will already be marked as dirty.

Ok, confirmed, git revert b80c3cb628f0ebc241b02e38dd028969fb8026a2 on
3.1-rc7 fixes the problem for me. Does this make sense, then, or do we
need further investigation and/or testing?

Simon-

^ permalink raw reply	[flat|nested] 16+ messages in thread
* Re: NFS client growing system CPU
  2011-09-28 19:58           ` Simon Kirby
@ 2011-09-30  0:58             ` Simon Kirby
  2011-09-30  1:11               ` Myklebust, Trond
  0 siblings, 1 reply; 16+ messages in thread
From: Simon Kirby @ 2011-09-30  0:58 UTC (permalink / raw)
  To: Trond Myklebust; +Cc: linux-nfs, linux-kernel

On Wed, Sep 28, 2011 at 12:58:35PM -0700, Simon Kirby wrote:

> On Tue, Sep 27, 2011 at 01:04:15PM -0400, Trond Myklebust wrote:
>
> > On Tue, 2011-09-27 at 09:49 -0700, Simon Kirby wrote:
> > > On Tue, Sep 27, 2011 at 07:42:53AM -0400, Trond Myklebust wrote:
> > >
> > > > On Mon, 2011-09-26 at 17:39 -0700, Simon Kirby wrote:
> > > > > Hello!
> > > > >
> > > > > Following up on "System CPU increasing on idle 2.6.36", this issue is
> > > > > still happening even on 3.1-rc7. So, since it has been 9 months since I
> > > > > reported this, I figured I'd bisect this issue. The first bisection ended
> > > > > in an IPMI regression that looked like the problem, so I had to start
> > > > > again. Eventually, I got commit b80c3cb628f0ebc241b02e38dd028969fb8026a2
> > > > > which made it into 2.6.34-rc4.
> > > > >
> > > > > With this commit, system CPU keeps rising as the log crunch box runs
> > > > > (reads log files via NFS and spews out HTML files into NFS-mounted report
> > > > > directories). When it finishes the daily run, the system time stays
> > > > > non-zero and continues to be higher and higher after each run, until the
> > > > > box never completes a run within a day due to all of the wasted cycles.
> > > >
> > > > So reverting that commit fixes the problem on 3.1-rc7?
> > > >
> > > > As far as I can see, doing so should be safe thanks to commit
> > > > 5547e8aac6f71505d621a612de2fca0dd988b439 (writeback: Update dirty flags
> > > > in two steps) which fixes the original problem at the VFS level.
> > >
> > > Hmm, I went to git revert b80c3cb628f0ebc241b02e38dd028969fb8026a2, but
> > > for some reason git left the nfs_mark_request_dirty(req); line in
> > > nfs_writepage_setup(), even though the original commit had that. Is that
> > > OK or should I remove that as well?
> > >
> > > Once that is sorted, I'll build it and let it run for a day and let you
> > > know. Thanks!
> >
> > It shouldn't make any difference whether you leave it or remove it. The
> > resulting second call to __set_page_dirty_nobuffers() will always be a
> > no-op since the page will already be marked as dirty.
>
> Ok, confirmed, git revert b80c3cb628f0ebc241b02e38dd028969fb8026a2 on
> 3.1-rc7 fixes the problem for me. Does this make sense, then, or do we
> need further investigation and/or testing?

Just to clear up what I said before, it seems that on plain 3.1-rc8, I am
actually able to clear the endless CPU use in nfs_writepages by just
running "sync". I am not sure when this changed, but I'm pretty sure that
some versions between 2.6.34 and 3.1-rc used to not be affected by just
"sync" unless it was paired with drop_caches. Maybe this makes the
problem more obvious...

Simon-

^ permalink raw reply	[flat|nested] 16+ messages in thread
* RE: NFS client growing system CPU
  2011-09-30  0:58             ` Simon Kirby
@ 2011-09-30  1:11               ` Myklebust, Trond
  2011-10-05 23:07                 ` Simon Kirby
  0 siblings, 1 reply; 16+ messages in thread
From: Myklebust, Trond @ 2011-09-30  1:11 UTC (permalink / raw)
  To: Simon Kirby; +Cc: linux-nfs, linux-kernel

> -----Original Message-----
> From: Simon Kirby [mailto:sim@hostway.ca]
> Sent: Thursday, September 29, 2011 8:58 PM
> To: Myklebust, Trond
> Cc: linux-nfs@vger.kernel.org; linux-kernel@vger.kernel.org
> Subject: Re: NFS client growing system CPU
>
> On Wed, Sep 28, 2011 at 12:58:35PM -0700, Simon Kirby wrote:
>
> > On Tue, Sep 27, 2011 at 01:04:15PM -0400, Trond Myklebust wrote:
> >
> > > On Tue, 2011-09-27 at 09:49 -0700, Simon Kirby wrote:
> > > > On Tue, Sep 27, 2011 at 07:42:53AM -0400, Trond Myklebust wrote:
> > > >
> > > > > On Mon, 2011-09-26 at 17:39 -0700, Simon Kirby wrote:
> > > > > > Hello!
> > > > > >
> > > > > > Following up on "System CPU increasing on idle 2.6.36", this
> > > > > > issue is still happening even on 3.1-rc7. So, since it has
> > > > > > been 9 months since I reported this, I figured I'd bisect
this
> > > > > > issue. The first bisection ended in an IPMI regression that
> > > > > > looked like the problem, so I had to start again.
Eventually,
> > > > > > I got commit b80c3cb628f0ebc241b02e38dd028969fb8026a2
> > > > > > which made it into 2.6.34-rc4.
> > > > > >
> > > > > > With this commit, system CPU keeps rising as the log crunch
> > > > > > box runs (reads log files via NFS and spews out HTML files
> > > > > > into NFS-mounted report directories). When it finishes the
> > > > > > daily run, the system time stays non-zero and continues to
be
> > > > > > higher and higher after each run, until the box never
completes a
> run within a day due to all of the wasted cycles.
> > > > >
> > > > > So reverting that commit fixes the problem on 3.1-rc7?
> > > > >
> > > > > As far as I can see, doing so should be safe thanks to commit
> > > > > 5547e8aac6f71505d621a612de2fca0dd988b439 (writeback: Update
> > > > > dirty flags in two steps) which fixes the original problem at
the VFS
> level.
> > > >
> > > > Hmm, I went to git revert
> > > > b80c3cb628f0ebc241b02e38dd028969fb8026a2, but for some reason
git
> > > > left the nfs_mark_request_dirty(req); line in
> > > > nfs_writepage_setup(), even though the original commit had that.
Is
> that OK or should I remove that as well?
> > > >
> > > > Once that is sorted, I'll build it and let it run for a day and
> > > > let you know. Thanks!
> > >
> > > It shouldn't make any difference whether you leave it or remove
it.
> > > The resulting second call to __set_page_dirty_nobuffers() will
> > > always be a no-op since the page will already be marked as dirty.
> >
> > Ok, confirmed, git revert b80c3cb628f0ebc241b02e38dd028969fb8026a2
on
> > 3.1-rc7 fixes the problem for me. Does this make sense, then, or do
we
> > need further investigation and/or testing?
>
> Just to clear up what I said before, it seems that on plain 3.1-rc8, I
am actually
> able to clear the endless CPU use in nfs_writepages by just running
"sync". I
> am not sure when this changed, but I'm pretty sure that some versions
> between 2.6.34 and 3.1-rc used to not be affected by just "sync"
unless it
> was paired with drop_caches. Maybe this makes the problem more
> obvious...

Hi Simon,

I think you are just finding yourself cycling through the VFS writeback
routines all the time because we dirty the inode for COMMIT at the same
time as we dirty a new page. Usually, we want to wait until after the
WRITE rpc call has completed, and so it was only the vfs race that
forced us to write this workaround so that we can guarantee reliable
fsync() behaviour.

My only concern at this point is to make sure that in reverting that
patch, we haven't overlooked some other fsync() bug that this patch
fixed. So far, it looks as if Dmitry's patch is sufficient to deal with
any issues that I can see.

Cheers
  Trond

^ permalink raw reply	[flat|nested] 16+ messages in thread
* Re: NFS client growing system CPU
  2011-09-30  1:11               ` Myklebust, Trond
@ 2011-10-05 23:07                 ` Simon Kirby
  0 siblings, 0 replies; 16+ messages in thread
From: Simon Kirby @ 2011-10-05 23:07 UTC (permalink / raw)
  To: Myklebust, Trond; +Cc: Mark Moseley, linux-nfs, linux-kernel

On Thu, Sep 29, 2011 at 06:11:17PM -0700, Myklebust, Trond wrote:

> > -----Original Message-----
> > From: Simon Kirby [mailto:sim@hostway.ca]
> > Sent: Thursday, September 29, 2011 8:58 PM
> > To: Myklebust, Trond
> > Cc: linux-nfs@vger.kernel.org; linux-kernel@vger.kernel.org
> > Subject: Re: NFS client growing system CPU
> >
> > On Wed, Sep 28, 2011 at 12:58:35PM -0700, Simon Kirby wrote:
> >
> > > On Tue, Sep 27, 2011 at 01:04:15PM -0400, Trond Myklebust wrote:
> > >
> > > > On Tue, 2011-09-27 at 09:49 -0700, Simon Kirby wrote:
> > > > > On Tue, Sep 27, 2011 at 07:42:53AM -0400, Trond Myklebust wrote:
> > > > >
> > > > > > On Mon, 2011-09-26 at 17:39 -0700, Simon Kirby wrote:
> > > > > > > Hello!
> > > > > > >
> > > > > > > Following up on "System CPU increasing on idle 2.6.36", this
> > > > > > > issue is still happening even on 3.1-rc7. So, since it has
> > > > > > > been 9 months since I reported this, I figured I'd bisect
> this
> > > > > > > issue. The first bisection ended in an IPMI regression that
> > > > > > > looked like the problem, so I had to start again.
> Eventually,
> > > > > > > I got commit b80c3cb628f0ebc241b02e38dd028969fb8026a2
> > > > > > > which made it into 2.6.34-rc4.
> > > > > > >
> > > > > > > With this commit, system CPU keeps rising as the log crunch
> > > > > > > box runs (reads log files via NFS and spews out HTML files
> > > > > > > into NFS-mounted report directories). When it finishes the
> > > > > > > daily run, the system time stays non-zero and continues to
> be
> > > > > > > higher and higher after each run, until the box never
> completes a
> > run within a day due to all of the wasted cycles.
> > > > > >
> > > > > > So reverting that commit fixes the problem on 3.1-rc7?
> > > > > >
> > > > > > As far as I can see, doing so should be safe thanks to commit
> > > > > > 5547e8aac6f71505d621a612de2fca0dd988b439 (writeback: Update
> > > > > > dirty flags in two steps) which fixes the original problem at
> the VFS
> > level.
> > > > >
> > > > > Hmm, I went to git revert
> > > > > b80c3cb628f0ebc241b02e38dd028969fb8026a2, but for some reason
> git
> > > > > left the nfs_mark_request_dirty(req); line in
> > > > > nfs_writepage_setup(), even though the original commit had that.
> Is
> > that OK or should I remove that as well?
> > > > >
> > > > > Once that is sorted, I'll build it and let it run for a day and
> > > > > let you know. Thanks!
> > > >
> > > > It shouldn't make any difference whether you leave it or remove
> it.
> > > > The resulting second call to __set_page_dirty_nobuffers() will
> > > > always be a no-op since the page will already be marked as dirty.
> > >
> > > Ok, confirmed, git revert b80c3cb628f0ebc241b02e38dd028969fb8026a2
> on
> > > 3.1-rc7 fixes the problem for me. Does this make sense, then, or do
> we
> > > need further investigation and/or testing?
> >
> > Just to clear up what I said before, it seems that on plain 3.1-rc8, I
> am actually
> > able to clear the endless CPU use in nfs_writepages by just running
> "sync". I
> > am not sure when this changed, but I'm pretty sure that some versions
> > between 2.6.34 and 3.1-rc used to not be affected by just "sync"
> unless it
> > was paired with drop_caches. Maybe this makes the problem more
> > obvious...
>
> Hi Simon,
>
> I think you are just finding yourself cycling through the VFS writeback
> routines all the time because we dirty the inode for COMMIT at the same
> time as we dirty a new page. Usually, we want to wait until after the
> WRITE rpc call has completed, and so it was only the vfs race that
> forced us to write this workaround so that we can guarantee reliable
> fsync() behaviour.
>
> My only concern at this point is to make sure that in reverting that
> patch, we haven't overlooked some other fsync() bug that this patch
> fixed. So far, it looks as if Dmitry's patch is sufficient to deal with
> any issues that I can see.

Hello!

So, this is a regression that has caused uptime issues for us since
2.6.34-rc4. Dmitry's patch went into 2.6.35, so I think this revert
should be committed and be a stable candidate for 2.6.35 - 3.1.

We have not seen any problems resulting from the revert, but our loads
are not particularly fsync()-heavy. How did things work before this
patch, anyway?

Here is another graph showing the revert fixing the problem on this box
with relatively simple workload (revert applied Tuesday evening):

http://0x.ca/sim/ref/3.1-rc8/cpu-analog02-revert-b80c3cb6.png

It is helping on many other boxes, too, but they get various spurts of
memory pressure and other CPU spikes that cause the difference to be
harder to see. We're still running your sunrpc/clnt.c debugging patch as
well, but haven't hit the hang again yet.

Simon-

^ permalink raw reply	[flat|nested] 16+ messages in thread
end of thread, other threads:[~2011-10-05 23:07 UTC | newest]

Thread overview: 16+ messages (download: mbox.gz follow: Atom feed
-- links below jump to the message on this page --
     [not found] <20101208212505.GA18192@hostway.ca>
     [not found] ` <20101218010801.GE28367@hostway.ca>
2010-12-29 22:03   ` System CPU increasing on idle 2.6.36 Simon Kirby
     [not found]     ` <AANLkTinq074Q-B=5B4_aXuBm-3ELwGknsJv+OvS1z1OX@mail.gmail.com>
2011-01-04 21:40       ` Simon Kirby
2011-01-05 19:43         ` Mark Moseley
2011-01-07 18:05           ` Mark Moseley
2011-01-07 18:12             ` Mark Moseley
2011-01-07 19:33               ` Mark Moseley
2011-01-08  0:52             ` Simon Kirby
2011-01-08  1:30               ` Mark Moseley
     [not found] ` <1291845189.3067.31.camel@heimdal.trondhjem.org>
2011-09-27  0:39   ` NFS client growing system CPU Simon Kirby
2011-09-27 11:42     ` Trond Myklebust
2011-09-27 16:49       ` Simon Kirby
2011-09-27 17:04         ` Trond Myklebust
2011-09-28 19:58           ` Simon Kirby
2011-09-30  0:58             ` Simon Kirby
2011-09-30  1:11               ` Myklebust, Trond
2011-10-05 23:07                 ` Simon Kirby
This is a public inbox, see mirroring instructions
for how to clone and mirror all data and code used for this inbox
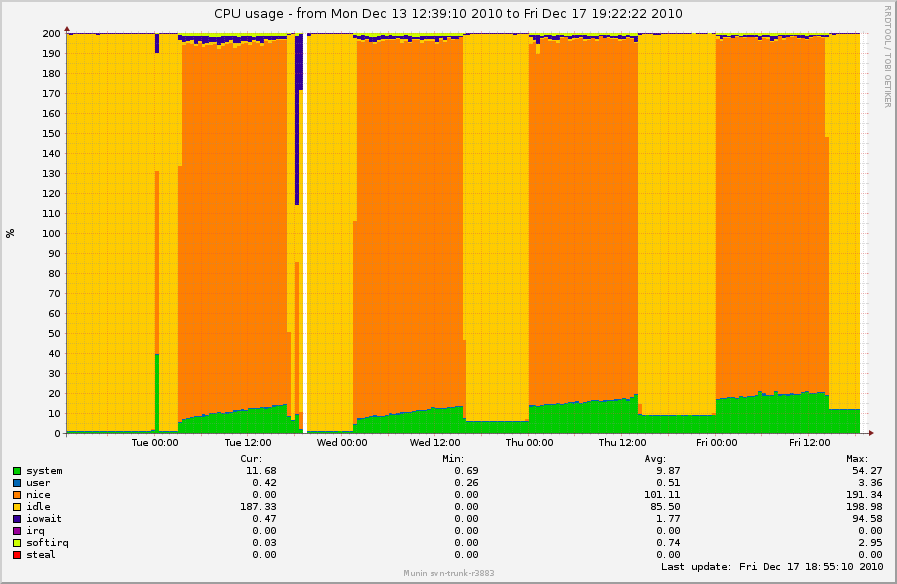
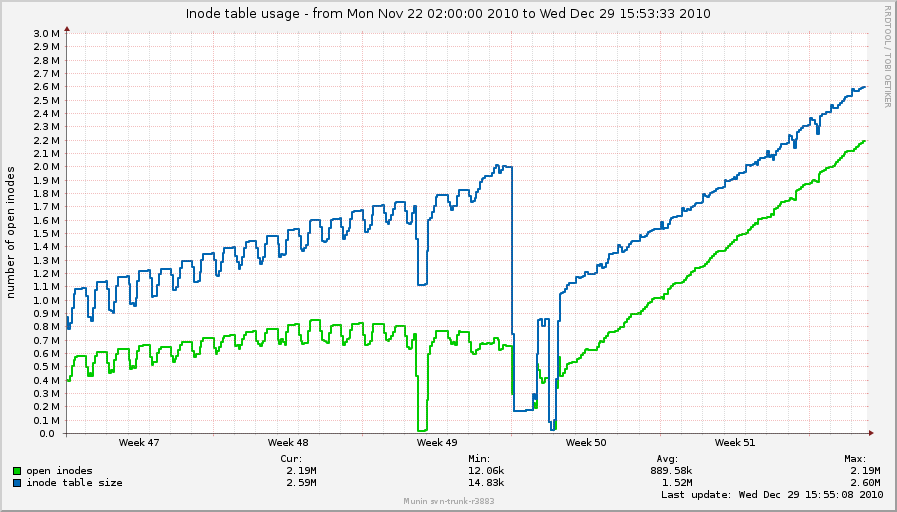
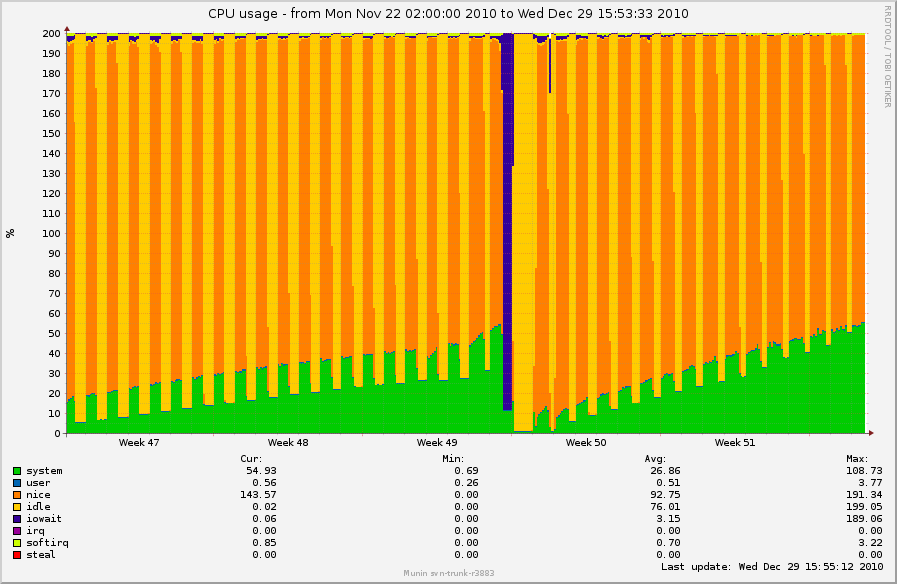
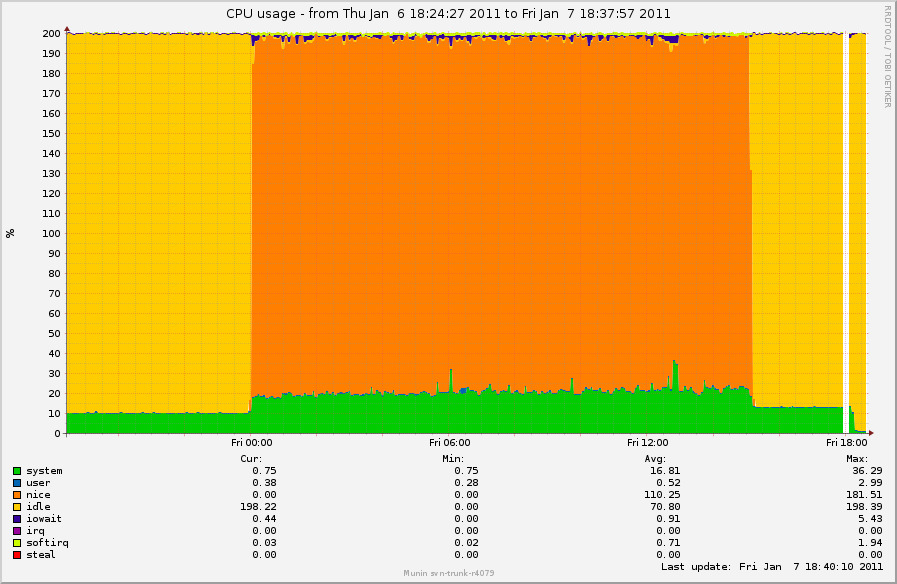
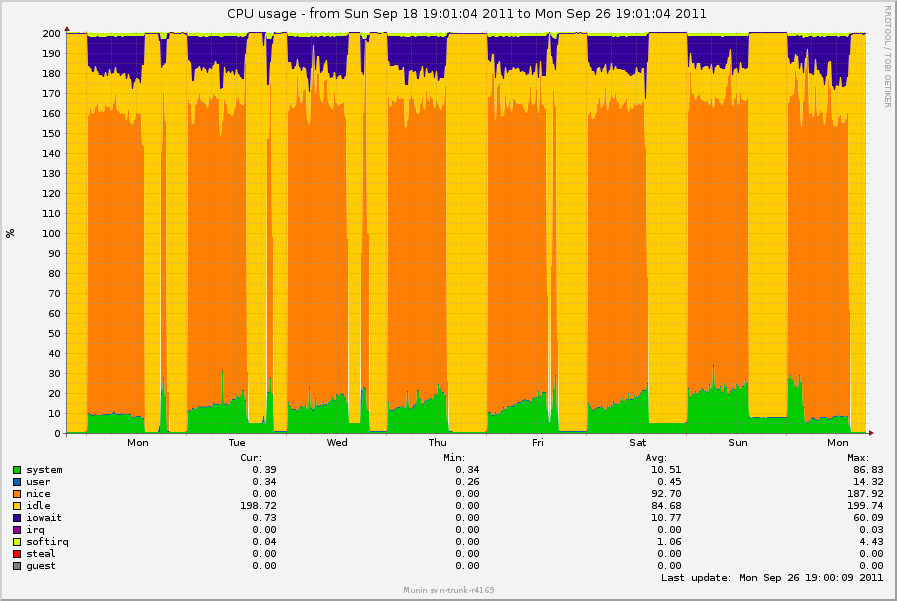
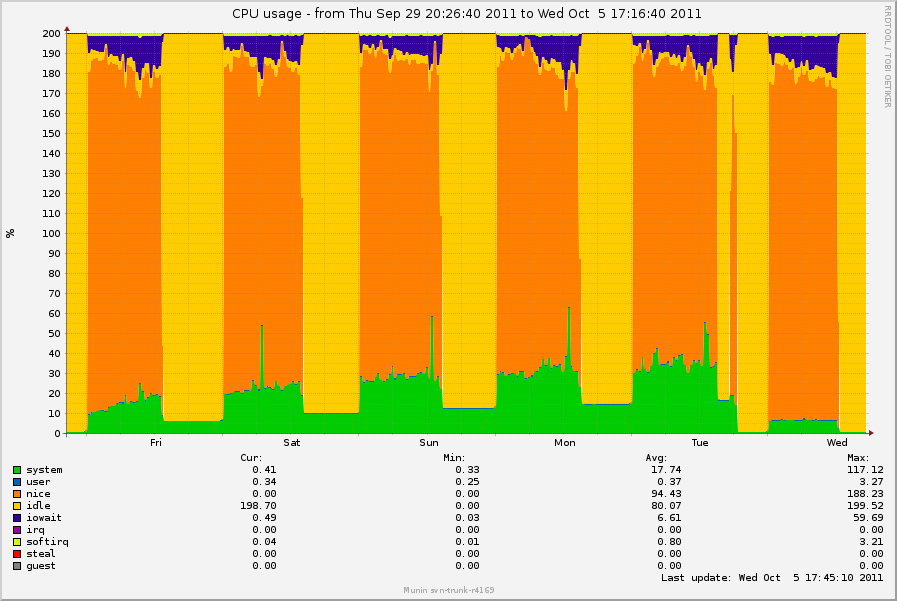