* [announce] [patch] ultra-scalable O(1) SMP and UP scheduler
@ 2002-01-04  2:19 Ingo Molnar
  2002-01-04  4:27 ` Oliver Xymoron
                   ` (6 more replies)
  0 siblings, 7 replies; 65+ messages in thread
From: Ingo Molnar @ 2002-01-04  2:19 UTC (permalink / raw)
  To: linux-kernel; +Cc: Linus Torvalds, Alan Cox


now that new-year's parties are over things are getting boring again. For
those who want to see and perhaps even try something more complex, i'm
announcing this patch that is a pretty radical rewrite of the Linux
scheduler for 2.5.2-pre6:

	http://redhat.com/~mingo/O(1)-scheduler/sched-O1-2.5.2-A0.patch

for 2.4.17:

	http://redhat.com/~mingo/O(1)-scheduler/sched-O1-2.4.17-A0.patch

Goal
====

The main goal of the new scheduler is to keep all the good things we know
and love about the current Linux scheduler:

 - good interactive performance even during high load: if the user
   types or clicks then the system must react instantly and must execute
   the user tasks smoothly, even during considerable background load.

 - good scheduling/wakeup performance with 1-2 runnable processes.

 - fairness: no process should stay without any timeslice for any
   unreasonable amount of time. No process should get an unjustly high
   amount of CPU time.

 - priorities: less important tasks can be started with lower priority,
   more important tasks with higher priority.

 - SMP efficiency: no CPU should stay idle if there is work to do.

 - SMP affinity: processes which run on one CPU should stay affine to
   that CPU. Processes should not bounce between CPUs too frequently.

 - plus additional scheduler features: RT scheduling, CPU binding.

and the goal is also to add a few new things:

 - fully O(1) scheduling. Are you tired of the recalculation loop
   blowing the L1 cache away every now and then? Do you think the goodness
   loop is taking a bit too long to finish if there are lots of runnable
   processes? This new scheduler takes no prisoners: wakeup(), schedule(),
   the timer interrupt are all O(1) algorithms. There is no recalculation
   loop. There is no goodness loop either.

 - 'perfect' SMP scalability. With the new scheduler there is no 'big'
   runqueue_lock anymore - it's all per-CPU runqueues and locks - two
   tasks on two separate CPUs can wake up, schedule and context-switch
   completely in parallel, without any interlocking. All
   scheduling-relevant data is structured for maximum scalability. (see
   the benchmark section later on.)

 - better SMP affinity. The old scheduler has a particular weakness that
   causes the random bouncing of tasks between CPUs if/when higher
   priority/interactive tasks, this was observed and reported by many
   people. The reason is that the timeslice recalculation loop first needs
   every currently running task to consume its timeslice. But when this
   happens on eg. an 8-way system, then this property starves an
   increasing number of CPUs from executing any process. Once the last
   task that has a timeslice left has finished using up that timeslice,
   the recalculation loop is triggered and other CPUs can start executing
   tasks again - after having idled around for a number of timer ticks.
   The more CPUs, the worse this effect.

   Furthermore, this same effect causes the bouncing effect as well:
   whenever there is such a 'timeslice squeeze' of the global runqueue,
   idle processors start executing tasks which are not affine to that CPU.
   (because the affine tasks have finished off their timeslices already.)

   The new scheduler solves this problem by distributing timeslices on a
   per-CPU basis, without having any global synchronization or
   recalculation.

 - batch scheduling. A significant proportion of computing-intensive tasks
   benefit from batch-scheduling, where timeslices are long and processes
   are roundrobin scheduled. The new scheduler does such batch-scheduling
   of the lowest priority tasks - so nice +19 jobs will get
   'batch-scheduled' automatically. With this scheduler, nice +19 jobs are
   in essence SCHED_IDLE, from an interactiveness point of view.

 - handle extreme loads more smoothly, without breakdown and scheduling
   storms.

 - O(1) RT scheduling. For those RT folks who are paranoid about the
   O(nr_running) property of the goodness loop and the recalculation loop.

 - run fork()ed children before the parent. Andrea has pointed out the
   advantages of this a few months ago, but patches for this feature
   do not work with the old scheduler as well as they should,
   because idle processes often steal the new child before the fork()ing
   CPU gets to execute it.


Design
======

(those who find the following design issues boring can skip to the next,
'Benchmarks' section.)

the core of the new scheduler are the following mechanizms:

 - *two*, priority-ordered 'priority arrays' per CPU. There is an 'active'
   array and an 'expired' array. The active array contains all tasks that
   are affine to this CPU and have timeslices left. The expired array
   contains all tasks which have used up their timeslices - but this array
   is kept sorted as well. The active and expired array is not accessed
   directly, it's accessed through two pointers in the per-CPU runqueue
   structure. If all active tasks are used up then we 'switch' the two
   pointers and from now on the ready-to-go (former-) expired array is the
   active array - and the empty active array serves as the new collector
   for expired tasks.

 - there is a 64-bit bitmap cache for array indices. Finding the highest
   priority task is thus a matter of two x86 BSFL bit-search instructions.

the split-array solution enables us to have an arbitrary number of active
and expired tasks, and the recalculation of timeslices can be done
immediately when the timeslice expires. Because the arrays are always
access through the pointers in the runqueue, switching the two arrays can
be done very quickly.

this is a hybride priority-list approach coupled with roundrobin
scheduling and the array-switch method of distributing timeslices.

 - there is a per-task 'load estimator'.

one of the toughest things to get right is good interactive feel during
heavy system load. While playing with various scheduler variants i found
that the best interactive feel is achieved not by 'boosting' interactive
tasks, but by 'punishing' tasks that want to use more CPU time than there
is available. This method is also much easier to do in an O(1) fashion.

to establish the actual 'load' the task contributes to the system, a
complex-looking but pretty accurate method is used: there is a 4-entry
'history' ringbuffer of the task's activities during the last 4 seconds.
This ringbuffer is operated without much overhead. The entries tell the
scheduler a pretty accurate load-history of the task: has it used up more
CPU time or less during the past N seconds. [the size '4' and the interval
of 4x 1 seconds was found by lots of experimentation - this part is
flexible and can be changed in both directions.]

the penalty a task gets for generating more load than the CPU can handle
is a priority decrease - there is a maximum amount to this penalty
relative to their static priority, so even fully CPU-bound tasks will
observe each other's priorities, and will share the CPU accordingly.

I've separated the RT scheduler into a different codebase, while still
keeping some of the scheduling codebase common. This does not look pretty
in certain places such as __sched_tail() or activate_task(), but i dont
think it can be avoided. RT scheduling is different, it uses a global
runqueue (and global spinlock) and it needs global decisions. To make RT
scheduling more instant, i've added a broadcast-reschedule message as
well, to make it absolutely sure that RT tasks of the right priority are
scheduled apropriately, even on SMP systems. The RT-scheduling part is
O(1) as well.

the SMP load-balancer can be extended/switched with additional parallel
computing and cache hierarchy concepts: NUMA scheduling, multi-core CPUs
can be supported easily by changing the load-balancer. Right now it's
tuned for my SMP systems.

i skipped the prev->mm == next->mm advantage - no workload i know of shows
any sensitivity to this. It can be added back by sacrificing O(1)
schedule() [the current and one-lower priority list can be searched for a
that->mm == current->mm condition], but costs a fair number of cycles
during a number of important workloads, so i wanted to avoid this as much
as possible.

- the SMP idle-task startup code was still racy and the new scheduler
triggered this. So i streamlined the idle-setup code a bit. We do not call
into schedule() before all processors have started up fully and all idle
threads are in place.

- the patch also cleans up a number of aspects of sched.c - moves code
into other areas of the kernel where it's appropriate, and simplifies
certain code paths and data constructs. As a result, the new scheduler's
code is smaller than the old one.

(i'm sure there are other details i forgot to explain. I've commented some
of the more important code paths and data constructs. If you think some
aspect of this design is faulty or misses some important issue then please
let me know.)

(the current code is by no means perfect, my main goal right now, besides
fixing bugs is to make the code cleaner. Any suggestions for
simplifications are welcome.)

Benchmarks
==========

i've performed two major groups of benchmarks: first i've verified the
interactive performance (interactive 'feel') of the new scheduler on UP
and SMP systems as well. While this is a pretty subjective thing, i found
that the new scheduler is at least as good as the old one in all areas,
and in a number of high load workloads it feels visibly smoother. I've
tried a number of workloads, such as make -j background compilation or
1000 background processes. Interactive performance can also be verified
via tracing both schedulers, and i've done that and found no areas of
missed wakeups or imperfect SMP scheduling latencies in either of the two
schedulers.

the other group of benchmarks was the actual performance of the scheduler.
I picked the following ones (some were intentionally picked to load the
scheduler, others were picked to make the benchmark spectrum more
complete):

 - compilation benchmarks

 - thr chat-server workload simulator written by Bill Hartner

 - the usual components from the lmbench suite

 - a heavily sched_yield()-ing testcode to measure yield() performance.

 [ i can test any other workload too that anyone would find interesting. ]

i ran these benchmarks on a 1-CPU box using a UP kernel, a 2-CPU and a
8-CPU box as well, using the SMP kernel.

The chat-server simulator creates a number of processes that are connected
to each other via TCP sockets, the processes send messages to each other
randomly, in a way that simulates actual chat server designs and
workloads.

3 successive runs of './chat_c 127.0.0.1 10 1000' produce the following
message throughput:

vanilla-2.5.2-pre6:

 Average throughput : 110619 messages per second
 Average throughput : 107813 messages per second
 Average throughput : 120558 messages per second

O(1)-schedule-2.5.2-pre6:

 Average throughput : 131250 messages per second
 Average throughput : 116333 messages per second
 Average throughput : 179686 messages per second

this is a rougly 20% improvement.

To get all benefits of the new scheduler, i ran it reniced, which in
essence triggers round-robin batch scheduling for the chat server tasks:

3 successive runs of 'nice -n 19 ./chat_c 127.0.0.1 10 1000' produce the
following throughput:

vanilla-2.5.2-pre6:

 Average throughput : 77719 messages per second
 Average throughput : 83460 messages per second
 Average throughput : 90029 messages per second

O(1)-schedule-2.5.2-pre6:

 Average throughput : 609942 messages per second
 Average throughput : 610221 messages per second
 Average throughput : 609570 messages per second

throughput improved by more than 600%. The UP and 2-way SMP tests show a
similar edge for the new scheduler. Furthermore, during these chatserver
tests, the old scheduler doesnt handle interactive tasks very well, and
the system is very jerky. (which is a side-effect of the overscheduling
situation the scheduler gets into.)

the 1-CPU UP numbers are interesting as well:

vanilla-2.5.2-pre6:

 ./chat_c 127.0.0.1 10 100
 Average throughput : 102885 messages per second
 Average throughput : 95319 messages per second
 Average throughput : 99076 messages per second

 nice -n 19 ./chat_c 127.0.0.1 10 1000
 Average throughput : 161205 messages per second
 Average throughput : 151785 messages per second
 Average throughput : 152951 messages per second

O(1)-schedule-2.5.2-pre6:

 ./chat_c 127.0.0.1 10 100 # NEW
 Average throughput : 128865 messages per second
 Average throughput : 115240 messages per second
 Average throughput : 99034 messages per second

 nice -n 19 ./chat_c 127.0.0.1 10 1000 # NEW
 Average throughput : 163112 messages per second
 Average throughput : 163012 messages per second
 Average throughput : 163652 messages per second

this shows that while on UP we dont have the scalability improvements, the
O(1) scheduler is still slightly ahead.


another benchmark measures sched_yield() performance. (which the pthreads
code relies on pretty heavily.)

on a 2-way system, starting 4 instances of ./loop_yield gives the
following context-switch throughput:

vanilla-2.5.2-pre6

  # vmstat 5 | cut -c57-
     system         cpu
   in    cs  us  sy  id
  102 241247   6  94   0
  101 240977   5  95   0
  101 241051   6  94   0
  101 241176   7  93   0

O(1)-schedule-2.5.2-pre6

  # vmstat 5 | cut -c57-
     system         cpu
   in     cs  us  sy  id
  101 977530  31  69   0
  101 977478  28  72   0
  101 977538  27  73   0

the O(1) scheduler is 300% faster, and we do nearly 1 million context
switches per second!

this test is even more interesting on the 8-way system, running 16
instances of loop_yield:

vanilla-2.5.2-pre6:

   vmstat 5 | cut -c57-
      system         cpu
    in     cs  us  sy  id
   106 108498   2  98   0
   101 108333   1  99   0
   102 108437   1  99   0

100K/sec context switches - the overhead of the global runqueue makes the
scheduler slower than the 2-way box!

O(1)-schedule-2.5.2-pre6:

    vmstat 5 | cut -c57-
     system         cpu
    in      cs  us  sy  id
   102 6120358  34  66   0
   101 6117063  33  67   0
   101 6117124  34  66   0

this is more than 6 million context switches per second! (i think this is
a first, no Linux box in existence did so many context switches per second
before.) This is one workload where the per-CPU runqueues and scalability
advantages show up big time.

here are the lat_proc and lat_ctx comparisons (the results quoted here are
the best numbers from a series of tests):

vanilla-2.5.2-pre6:

  ./lat_proc fork
  Process fork+exit: 440.0000 microseconds
  ./lat_proc exec
  Process fork+execve: 491.6364 microseconds
  ./lat_proc shell
  Process fork+/bin/sh -c: 3545.0000 microseconds

O(1)-schedule-2.5.2-pre6:

  ./lat_proc fork
  Process fork+exit: 168.6667 microseconds
  ./lat_proc exec
  Process fork+execve: 279.6500 microseconds
  ./lat_proc shell
  Process fork+/bin/sh -c: 2874.0000 microseconds

the difference is pretty dramatic - it's mostly due to avoiding much of
the COW overhead that comes from fork()+execve(). The fork()+exit()
improvement is mostly due to better CPU affinity - parent and child are
running on the same CPU, while the old scheduler pushes the child to
another, idle CPU, which creates heavy interlocking traffic between the MM
structures.

the compilation benchmarks i ran gave very similar results for both
schedulers. The O(1) scheduler has a small 2% advantage in make -j
benchmarks (not accounting statistical noise - it's hard to produce
reliable compilation benchmarks) - probably due to better SMP affinity
again.

Status
======

i've tested the new scheduler under the aforementioned range of systems
and workloads, but it's still experimental code nevertheless. I've
developed it on SMP systems using the 2.5.2-pre kernels, so it has the
most testing there, but i did a fair number of UP and 2.4.17 tests as
well. NOTE! For the 2.5.2-pre6 kernel to be usable you should apply
Andries' latest 2.5.2pre6-kdev_t patch available at:

	http://www.kernel.org/pub/linux/kernel/people/aeb/

i also tested the RT scheduler for various situations such as
sched_yield()-ing of RT tasks, strace-ing RT tasks and other details, and
it's all working as expected. There might be some rough edges though.

Comments, bug reports, suggestions are welcome,

	Ingo


^ permalink raw reply	[flat|nested] 65+ messages in thread
* Re: [announce] [patch] ultra-scalable O(1) SMP and UP scheduler
2002-01-04 2:19 [announce] [patch] ultra-scalable O(1) SMP and UP scheduler Ingo Molnar
@ 2002-01-04 4:27 ` Oliver Xymoron
2002-01-04 5:34 ` Ian Morgan
` (5 subsequent siblings)
6 siblings, 0 replies; 65+ messages in thread
From: Oliver Xymoron @ 2002-01-04 4:27 UTC (permalink / raw)
To: Ingo Molnar; +Cc: linux-kernel, Linus Torvalds, Alan Cox
On Fri, 4 Jan 2002, Ingo Molnar wrote:
> this is more than 6 million context switches per second!
<yawn>
Everyone knows scheduling is boring.
:)
--
"Love the dolphins," she advised him. "Write by W.A.S.T.E.."
^ permalink raw reply [flat|nested] 65+ messages in thread* Re: [announce] [patch] ultra-scalable O(1) SMP and UP scheduler
2002-01-04 2:19 [announce] [patch] ultra-scalable O(1) SMP and UP scheduler Ingo Molnar
2002-01-04 4:27 ` Oliver Xymoron
@ 2002-01-04 5:34 ` Ian Morgan
2002-01-04 10:30 ` Anton Blanchard
` (4 subsequent siblings)
6 siblings, 0 replies; 65+ messages in thread
From: Ian Morgan @ 2002-01-04 5:34 UTC (permalink / raw)
To: Ingo Molnar; +Cc: Linux Kernel Mailing List
On Fri, 4 Jan 2002, Ingo Molnar wrote:
> for 2.4.17:
>
> http://redhat.com/~mingo/O(1)-scheduler/sched-O1-2.4.17-A0.patch
> i did a fair number of UP and 2.4.17 tests as well.
> Comments, bug reports, suggestions are welcome,
Well, tried it out here on 2.4.17 (w/ ide.2.4.16 & freeswan_1.91) (and after
patching md.c and loop.c), and boy did it blow chunks! ;-)
First, loading the software watchdog module caused the thing to lock up
solid during boot. No SysRq response, and nmi_watchdog did nada too.
Next, after disabling the s/w watchdog, I could boot up.. great, I though it
was all happy. I tried starting up 1 instance of setiathome, and saw how
nicely it (mostly) remained affine to 1 processor, occasionally switching to
the 2nd, and back again, maybe every 5-10 seconds.
Next, though, I couldn't figure out why Mozilla wouldn't load. Then I
noticed I could not open any more xterms. When I went to one open xterm to
do some digging, I noticed very long pauses, where no keyboard input would
be accepted, yet the mouse and the window manager remained responsive. Other
tasks, like my scrolling network usage graph applet would stall as well.
Eventually (after another minute or so), the box locked up solid.
Well, I really liked the sound of this patch. Seemed very well though out.
Too bad it doesn't like me! :-(
You seem to indicate you've done (some) testing on 2.4.17, so I'm somewhat
surprised that it died on me so quickly here. What more info can I give you
that might help track the problem?
Box: 2x Celeron / ABIT BP6 / 384MB
Gnu C 2.95.3
Gnu make 3.78.1
binutils 2.10.1.0.2
util-linux 2.10s
mount 2.10s
modutils 2.4.0
e2fsprogs 1.19
reiserfsprogs 3.x.0j
pcmcia-cs 3.1.31
PPP 2.4.0
Linux C Library 2.1.3
Dynamic linker (ldd) 2.1.3
Linux C++ Library 2.10.0
Procps 2.0.6
Net-tools 1.54
Console-tools 0.3.3
Sh-utils 2.0
Modules Loaded sb sb_lib uart401 sound soundcore printer hid input
usb-uhci usbcore tulip ipt_mac ipt_state iptable_mangle ipt_LOG ipt_REJECT
ip_nat_ftp ip_conntrack_ftp iptable_nat ip_conntrack iptable_filter
ip_tables
Regards,
Ian Morgan
--
-------------------------------------------------------------------
Ian E. Morgan Vice President & C.O.O. Webcon, Inc.
imorgan@webcon.net PGP: #2DA40D07 www.webcon.net
-------------------------------------------------------------------
^ permalink raw reply [flat|nested] 65+ messages in thread* Re: [announce] [patch] ultra-scalable O(1) SMP and UP scheduler
2002-01-04 2:19 [announce] [patch] ultra-scalable O(1) SMP and UP scheduler Ingo Molnar
2002-01-04 4:27 ` Oliver Xymoron
2002-01-04 5:34 ` Ian Morgan
@ 2002-01-04 10:30 ` Anton Blanchard
2002-01-04 12:53 ` Ingo Molnar
2002-01-04 14:18 ` Thomas Cataldo
` (3 subsequent siblings)
6 siblings, 1 reply; 65+ messages in thread
From: Anton Blanchard @ 2002-01-04 10:30 UTC (permalink / raw)
To: Ingo Molnar; +Cc: linux-kernel, Linus Torvalds, Alan Cox
Great stuff Ingo!
> now that new-year's parties are over things are getting boring again. For
> those who want to see and perhaps even try something more complex, i'm
> announcing this patch that is a pretty radical rewrite of the Linux
> scheduler for 2.5.2-pre6:
Good timing :) We were just looking at an application that hit sched_yield
heavily on a large SMP machine (dont have the source so fixing the
symptoms not the cause). Performance was pretty bad with the standard
scheduler.
We managed to get a 4 way ppc64 machine to boot, but unfortunately the
18 way hung somewhere after smp initialisation and before execing
init. More testing to come :)
Is the idle loop optimisation (atomic exchange -1 into need_resched
to avoid IPI) gone forever?
Is my understanding of this right?:
#define BITMAP_SIZE (MAX_RT_PRIO/8+1)
...
char bitmap[BITMAP_SIZE+1];
list_t queue[MAX_RT_PRIO];
You have an bitmap of size MAX_RT_PRIO+1 (actually I think you have one too
many +1 here :) and you zero the last bit to terminate it. You use
find_first_zero_bit to search the entire priority list and
sched_find_first_zero_bit to search only the first MAX_PRIO (64) bits.
> the SMP load-balancer can be extended/switched with additional parallel
> computing and cache hierarchy concepts: NUMA scheduling, multi-core CPUs
> can be supported easily by changing the load-balancer. Right now it's
> tuned for my SMP systems.
It will be interesting to test this on our HMT hardware.
> - the SMP idle-task startup code was still racy and the new scheduler
> triggered this. So i streamlined the idle-setup code a bit. We do not call
> into schedule() before all processors have started up fully and all idle
> threads are in place.
I like this cleanup, it pushes more stuff out the arch specific code
into init_idle().
> another benchmark measures sched_yield() performance. (which the pthreads
> code relies on pretty heavily.)
Can you send me this benchmark and I'll get some more results :)
I dont think pthreads uses sched_yield on spinlocks any more, but there
seems to be enough userspace code that does.
Anton
^ permalink raw reply [flat|nested] 65+ messages in thread* Re: [announce] [patch] ultra-scalable O(1) SMP and UP scheduler
2002-01-04 10:30 ` Anton Blanchard
@ 2002-01-04 12:53 ` Ingo Molnar
0 siblings, 0 replies; 65+ messages in thread
From: Ingo Molnar @ 2002-01-04 12:53 UTC (permalink / raw)
To: Anton Blanchard; +Cc: linux-kernel, Linus Torvalds, Alan Cox
On Fri, 4 Jan 2002, Anton Blanchard wrote:
> Good timing :) We were just looking at an application that hit
> sched_yield heavily on a large SMP machine (dont have the source so
> fixing the symptoms not the cause). Performance was pretty bad with
> the standard scheduler.
hey, great. I mean, what a pity :-| But in any case, sched_yield() is just
a tiny portion of the scheduler spectrum, and it's certainly not the most
important one.
> We managed to get a 4 way ppc64 machine to boot, but unfortunately the
> 18 way hung somewhere after smp initialisation and before execing
> init. More testing to come :)
could this be the child-runs-first problem perhaps? You can disable it by
exchanging wake_up_forked_process() for wake_up_process() in fork.c, and
removing the current->need_resched = 1 line.
> Is the idle loop optimisation (atomic exchange -1 into need_resched to
> avoid IPI) gone forever?
it's just broken temporarily, i will fix it. The two places the need to
set need_resched is the timer interrupt (that triggers periodic
load_balance()) and the wakeup code, i'll fix this in the next patch.
> Is my understanding of this right?:
>
> #define BITMAP_SIZE (MAX_RT_PRIO/8+1)
>
> ...
>
> char bitmap[BITMAP_SIZE+1];
> list_t queue[MAX_RT_PRIO];
>
> You have an bitmap of size MAX_RT_PRIO+1 (actually I think you have
> one too many +1 here :) [...]
[ yes :-) paranoia. will fix it. ]
> [...] and you zero the last bit to terminate it. You
> use find_first_zero_bit to search the entire priority list and
> sched_find_first_zero_bit to search only the first MAX_PRIO (64) bits.
correct.
the reason for this logic inversion is temporary as well: we'll have to
add find_next_set_bit before doing the more intuitive thing of setting the
bit when the runlist is active. Right now sched_find_first_zero_bit() has
to invert the value (on x86) again to get it right for BSFL.
> > - the SMP idle-task startup code was still racy and the new scheduler
> > triggered this. So i streamlined the idle-setup code a bit. We do not call
> > into schedule() before all processors have started up fully and all idle
> > threads are in place.
>
> I like this cleanup, it pushes more stuff out the arch specific code
> into init_idle().
the new rules are this: no schedule() must be called before all bits in
wait_init_idle are clear. I'd suggest for you to add this to the top of
schedule():
if (wait_init_idle)
BUG();
to debug the SMP startup code.
the other new property is that the init thread wakes itself up and then
later on becomes an idle thread just like the other idle threads. This
makes the idle startup code more symmetric, and the scheduler more
debuggable.
Ingo
^ permalink raw reply [flat|nested] 65+ messages in thread
* Re: [announce] [patch] ultra-scalable O(1) SMP and UP scheduler
  2002-01-04  2:19 [announce] [patch] ultra-scalable O(1) SMP and UP scheduler Ingo Molnar
                   ` (2 preceding siblings ...)
  2002-01-04 10:30 ` Anton Blanchard
@ 2002-01-04 14:18 ` Thomas Cataldo
  2002-01-04 14:46 ` dan kelley
                   ` (2 subsequent siblings)
  6 siblings, 0 replies; 65+ messages in thread
From: Thomas Cataldo @ 2002-01-04 14:18 UTC (permalink / raw)
  To: mingo; +Cc: linux-kernel

Patch applied to 2.4.17 vanilla. Oops on startup, mounting partitions.
Without mounting my vfat partition, I can boot up but X freezed
completely after one minute.


ksymoops 2.4.3 on i686 2.4.17.  Options used
      -V (default)
      -k /proc/ksyms (default)
      -l /proc/modules (default)
      -o /lib/modules/2.4.17/ (default)
      -m /boot/System.map-2.4.17 (default)

Warning: You did not tell me where to find symbol information.  I will
assume that the log matches the kernel and modules that are running
right now and I'll use the default options above for symbol resolution.
If the current kernel and/or modules do not match the log, you can get
more accurate output by telling me the kernel version and where to find
map, modules, ksyms etc.  ksymoops -h explains the options.

cpu: 0, clocks: 1002224, slice: 334074
cpu: 1, clocks: 1002224, slice: 334074
cpu 1 has done init idle, doing cpu_idle().
Unable to handle kernel NULL pointer dereference at virtual address 00000008
e0852f65
*pde = 00000000
Oops: 0000
CPU:    1
EIP:    0010:[<e0852f65>]    Not tainted
Using defaults from ksymoops -t elf32-i386 -a i386
EFLAGS: 00010286
eax: 00000000   ebx: dfb5bdbc   ecx: dfb5be70   edx: 00000000
esi: dfeee200   edi: dfb5be24   ebp: dfb5be88   esp: dfb5bd40
ds: 0018   es: 0018   ss: 0018
Process mount (pid: 82, stackpage=dfb5b000)
Stack: dfb5bdbc dfeee200 dfb5be24 dfb5be88 fffffffa dfbd8da0 00000001
c0194b1f
        c1864000 c1849600 e0853af8 df86a000 dfb5bdb4 dfb5bdb8 dfb5be70
dfb5be24
        dfb5bdbc dfeee200 dfeee200 df86a000 dfb5be70 dfeee2cc 00000803
00000000
Call Trace: [<c0194b1f>] [<e0853af8>] [<c013a370>] [<e085af7b>]
[<e085b520>]
    [<c013904c>] [<e085b560>] [<c0148e83>] [<c013965b>] [<e085b560>]
[<c0149c89>]
    [<c0149f0f>] [<c0149d84>] [<c0149fd7>] [<c0106f6b>]
Code: 0f b7 40 08 66 89 41 08 8a 41 14 66 c7 41 0a 00 00 80 61 15

 >>EIP; e0852f64 <[fat]parse_options+3c/7fc>   <=====
Trace; c0194b1e <sym_queue_command+ae/c0>
Trace; e0853af8 <[fat]fat_read_super+dc/86c>
Trace; c013a370 <blkdev_get+68/78>
Trace; e085af7a <[vfat]vfat_read_super+22/88>
Trace; e085b520 <[vfat]vfat_dir_inode_operations+0/40>
Trace; c013904c <get_sb_bdev+254/30c>
Trace; e085b560 <[vfat]vfat_fs_type+0/1a>
Trace; c0148e82 <set_devname+26/54>
Trace; c013965a <do_kern_mount+aa/150>
Trace; e085b560 <[vfat]vfat_fs_type+0/1a>
Trace; c0149c88 <do_add_mount+20/cc>
Trace; c0149f0e <do_mount+13a/154>
Trace; c0149d84 <copy_mount_options+50/a0>
Trace; c0149fd6 <sys_mount+ae/11c>
Trace; c0106f6a <system_call+32/38>
Code;  e0852f64 <[fat]parse_options+3c/7fc>
00000000 <_EIP>:
Code;  e0852f64 <[fat]parse_options+3c/7fc>   <=====
    0:   0f b7 40 08               movzwl 0x8(%eax),%eax   <=====
Code;  e0852f68 <[fat]parse_options+40/7fc>
    4:   66 89 41 08               mov    %ax,0x8(%ecx)
Code;  e0852f6c <[fat]parse_options+44/7fc>
    8:   8a 41 14                  mov    0x14(%ecx),%al
Code;  e0852f6e <[fat]parse_options+46/7fc>
    b:   66 c7 41 0a 00 00         movw   $0x0,0xa(%ecx)
Code;  e0852f74 <[fat]parse_options+4c/7fc>
   11:   80 61 15 00               andb   $0x0,0x15(%ecx)


14 warnings issued.  Results may not be reliable.


Ingo Molnar wrote:

> now that new-year's parties are over things are getting boring again. For
> those who want to see and perhaps even try something more complex, i'm
> announcing this patch that is a pretty radical rewrite of the Linux
> scheduler for 2.5.2-pre6:
>
> 	http://redhat.com/~mingo/O(1)-scheduler/sched-O1-2.5.2-A0.patch
>
> for 2.4.17:
>
> 	http://redhat.com/~mingo/O(1)-scheduler/sched-O1-2.4.17-A0.patch
>
> Goal
> ====
>
> The main goal of the new scheduler is to keep all the good things we know
> and love about the current Linux scheduler:
>
>  - good interactive performance even during high load: if the user
>    types or clicks then the system must react instantly and must execute
>    the user tasks smoothly, even during considerable background load.
>
>  - good scheduling/wakeup performance with 1-2 runnable processes.
>
>  - fairness: no process should stay without any timeslice for any
>    unreasonable amount of time. No process should get an unjustly high
>    amount of CPU time.
>
>  - priorities: less important tasks can be started with lower priority,
>    more important tasks with higher priority.
>
>  - SMP efficiency: no CPU should stay idle if there is work to do.
>
>  - SMP affinity: processes which run on one CPU should stay affine to
>    that CPU. Processes should not bounce between CPUs too frequently.
>
>  - plus additional scheduler features: RT scheduling, CPU binding.
>
> and the goal is also to add a few new things:
>
>  - fully O(1) scheduling. Are you tired of the recalculation loop
>    blowing the L1 cache away every now and then? Do you think the goodness
>    loop is taking a bit too long to finish if there are lots of runnable
>    processes? This new scheduler takes no prisoners: wakeup(), schedule(),
>    the timer interrupt are all O(1) algorithms. There is no recalculation
>    loop. There is no goodness loop either.
>
>  - 'perfect' SMP scalability. With the new scheduler there is no 'big'
>    runqueue_lock anymore - it's all per-CPU runqueues and locks - two
>    tasks on two separate CPUs can wake up, schedule and context-switch
>    completely in parallel, without any interlocking. All
>    scheduling-relevant data is structured for maximum scalability. (see
>    the benchmark section later on.)
>
>  - better SMP affinity. The old scheduler has a particular weakness that
>    causes the random bouncing of tasks between CPUs if/when higher
>    priority/interactive tasks, this was observed and reported by many
>    people. The reason is that the timeslice recalculation loop first needs
>    every currently running task to consume its timeslice. But when this
>    happens on eg. an 8-way system, then this property starves an
>    increasing number of CPUs from executing any process. Once the last
>    task that has a timeslice left has finished using up that timeslice,
>    the recalculation loop is triggered and other CPUs can start executing
>    tasks again - after having idled around for a number of timer ticks.
>    The more CPUs, the worse this effect.
>
>    Furthermore, this same effect causes the bouncing effect as well:
>    whenever there is such a 'timeslice squeeze' of the global runqueue,
>    idle processors start executing tasks which are not affine to that CPU.
>    (because the affine tasks have finished off their timeslices already.)
>
>    The new scheduler solves this problem by distributing timeslices on a
>    per-CPU basis, without having any global synchronization or
>    recalculation.
>
>  - batch scheduling. A significant proportion of computing-intensive tasks
>    benefit from batch-scheduling, where timeslices are long and processes
>    are roundrobin scheduled. The new scheduler does such batch-scheduling
>    of the lowest priority tasks - so nice +19 jobs will get
>    'batch-scheduled' automatically. With this scheduler, nice +19 jobs are
>    in essence SCHED_IDLE, from an interactiveness point of view.
>
>  - handle extreme loads more smoothly, without breakdown and scheduling
>    storms.
>
>  - O(1) RT scheduling. For those RT folks who are paranoid about the
>    O(nr_running) property of the goodness loop and the recalculation loop.
>
>  - run fork()ed children before the parent. Andrea has pointed out the
>    advantages of this a few months ago, but patches for this feature
>    do not work with the old scheduler as well as they should,
>    because idle processes often steal the new child before the fork()ing
>    CPU gets to execute it.
>
>
> Design
> ======
>
> (those who find the following design issues boring can skip to the next,
> 'Benchmarks' section.)
>
> the core of the new scheduler are the following mechanizms:
>
>  - *two*, priority-ordered 'priority arrays' per CPU. There is an 'active'
>    array and an 'expired' array. The active array contains all tasks that
>    are affine to this CPU and have timeslices left. The expired array
>    contains all tasks which have used up their timeslices - but this array
>    is kept sorted as well. The active and expired array is not accessed
>    directly, it's accessed through two pointers in the per-CPU runqueue
>    structure. If all active tasks are used up then we 'switch' the two
>    pointers and from now on the ready-to-go (former-) expired array is the
>    active array - and the empty active array serves as the new collector
>    for expired tasks.
>
>  - there is a 64-bit bitmap cache for array indices. Finding the highest
>    priority task is thus a matter of two x86 BSFL bit-search instructions.
>
> the split-array solution enables us to have an arbitrary number of active
> and expired tasks, and the recalculation of timeslices can be done
> immediately when the timeslice expires. Because the arrays are always
> access through the pointers in the runqueue, switching the two arrays can
> be done very quickly.
>
> this is a hybride priority-list approach coupled with roundrobin
> scheduling and the array-switch method of distributing timeslices.
>
>  - there is a per-task 'load estimator'.
>
> one of the toughest things to get right is good interactive feel during
> heavy system load. While playing with various scheduler variants i found
> that the best interactive feel is achieved not by 'boosting' interactive
> tasks, but by 'punishing' tasks that want to use more CPU time than there
> is available. This method is also much easier to do in an O(1) fashion.
>
> to establish the actual 'load' the task contributes to the system, a
> complex-looking but pretty accurate method is used: there is a 4-entry
> 'history' ringbuffer of the task's activities during the last 4 seconds.
> This ringbuffer is operated without much overhead. The entries tell the
> scheduler a pretty accurate load-history of the task: has it used up more
> CPU time or less during the past N seconds. [the size '4' and the interval
> of 4x 1 seconds was found by lots of experimentation - this part is
> flexible and can be changed in both directions.]
>
> the penalty a task gets for generating more load than the CPU can handle
> is a priority decrease - there is a maximum amount to this penalty
> relative to their static priority, so even fully CPU-bound tasks will
> observe each other's priorities, and will share the CPU accordingly.
>
> I've separated the RT scheduler into a different codebase, while still
> keeping some of the scheduling codebase common. This does not look pretty
> in certain places such as __sched_tail() or activate_task(), but i dont
> think it can be avoided. RT scheduling is different, it uses a global
> runqueue (and global spinlock) and it needs global decisions. To make RT
> scheduling more instant, i've added a broadcast-reschedule message as
> well, to make it absolutely sure that RT tasks of the right priority are
> scheduled apropriately, even on SMP systems. The RT-scheduling part is
> O(1) as well.
>
> the SMP load-balancer can be extended/switched with additional parallel
> computing and cache hierarchy concepts: NUMA scheduling, multi-core CPUs
> can be supported easily by changing the load-balancer. Right now it's
> tuned for my SMP systems.
>
> i skipped the prev->mm == next->mm advantage - no workload i know of shows
> any sensitivity to this. It can be added back by sacrificing O(1)
> schedule() [the current and one-lower priority list can be searched for a
> that->mm == current->mm condition], but costs a fair number of cycles
> during a number of important workloads, so i wanted to avoid this as much
> as possible.
>
> - the SMP idle-task startup code was still racy and the new scheduler
> triggered this. So i streamlined the idle-setup code a bit. We do not call
> into schedule() before all processors have started up fully and all idle
> threads are in place.
>
> - the patch also cleans up a number of aspects of sched.c - moves code
> into other areas of the kernel where it's appropriate, and simplifies
> certain code paths and data constructs. As a result, the new scheduler's
> code is smaller than the old one.
>
> (i'm sure there are other details i forgot to explain. I've commented some
> of the more important code paths and data constructs. If you think some
> aspect of this design is faulty or misses some important issue then please
> let me know.)
>
> (the current code is by no means perfect, my main goal right now, besides
> fixing bugs is to make the code cleaner. Any suggestions for
> simplifications are welcome.)
>
> Benchmarks
> ==========
>
> i've performed two major groups of benchmarks: first i've verified the
> interactive performance (interactive 'feel') of the new scheduler on UP
> and SMP systems as well. While this is a pretty subjective thing, i found
> that the new scheduler is at least as good as the old one in all areas,
> and in a number of high load workloads it feels visibly smoother. I've
> tried a number of workloads, such as make -j background compilation or
> 1000 background processes. Interactive performance can also be verified
> via tracing both schedulers, and i've done that and found no areas of
> missed wakeups or imperfect SMP scheduling latencies in either of the two
> schedulers.
>
> the other group of benchmarks was the actual performance of the scheduler.
> I picked the following ones (some were intentionally picked to load the
> scheduler, others were picked to make the benchmark spectrum more
> complete):
>
>  - compilation benchmarks
>
>  - thr chat-server workload simulator written by Bill Hartner
>
>  - the usual components from the lmbench suite
>
>  - a heavily sched_yield()-ing testcode to measure yield() performance.
>
>  [ i can test any other workload too that anyone would find interesting. ]
>
> i ran these benchmarks on a 1-CPU box using a UP kernel, a 2-CPU and a
> 8-CPU box as well, using the SMP kernel.
>
> The chat-server simulator creates a number of processes that are connected
> to each other via TCP sockets, the processes send messages to each other
> randomly, in a way that simulates actual chat server designs and
> workloads.
>
> 3 successive runs of './chat_c 127.0.0.1 10 1000' produce the following
> message throughput:
>
> vanilla-2.5.2-pre6:
>
>  Average throughput : 110619 messages per second
>  Average throughput : 107813 messages per second
>  Average throughput : 120558 messages per second
>
> O(1)-schedule-2.5.2-pre6:
>
>  Average throughput : 131250 messages per second
>  Average throughput : 116333 messages per second
>  Average throughput : 179686 messages per second
>
> this is a rougly 20% improvement.
>
> To get all benefits of the new scheduler, i ran it reniced, which in
> essence triggers round-robin batch scheduling for the chat server tasks:
>
> 3 successive runs of 'nice -n 19 ./chat_c 127.0.0.1 10 1000' produce the
> following throughput:
>
> vanilla-2.5.2-pre6:
>
>  Average throughput : 77719 messages per second
>  Average throughput : 83460 messages per second
>  Average throughput : 90029 messages per second
>
> O(1)-schedule-2.5.2-pre6:
>
>  Average throughput : 609942 messages per second
>  Average throughput : 610221 messages per second
>  Average throughput : 609570 messages per second
>
> throughput improved by more than 600%. The UP and 2-way SMP tests show a
> similar edge for the new scheduler. Furthermore, during these chatserver
> tests, the old scheduler doesnt handle interactive tasks very well, and
> the system is very jerky. (which is a side-effect of the overscheduling
> situation the scheduler gets into.)
>
> the 1-CPU UP numbers are interesting as well:
>
> vanilla-2.5.2-pre6:
>
>  ./chat_c 127.0.0.1 10 100
>  Average throughput : 102885 messages per second
>  Average throughput : 95319 messages per second
>  Average throughput : 99076 messages per second
>
>  nice -n 19 ./chat_c 127.0.0.1 10 1000
>  Average throughput : 161205 messages per second
>  Average throughput : 151785 messages per second
>  Average throughput : 152951 messages per second
>
> O(1)-schedule-2.5.2-pre6:
>
>  ./chat_c 127.0.0.1 10 100 # NEW
>  Average throughput : 128865 messages per second
>  Average throughput : 115240 messages per second
>  Average throughput : 99034 messages per second
>
>  nice -n 19 ./chat_c 127.0.0.1 10 1000 # NEW
>  Average throughput : 163112 messages per second
>  Average throughput : 163012 messages per second
>  Average throughput : 163652 messages per second
>
> this shows that while on UP we dont have the scalability improvements, the
> O(1) scheduler is still slightly ahead.
>
>
> another benchmark measures sched_yield() performance. (which the pthreads
> code relies on pretty heavily.)
>
> on a 2-way system, starting 4 instances of ./loop_yield gives the
> following context-switch throughput:
>
> vanilla-2.5.2-pre6
>
>   # vmstat 5 | cut -c57-
>      system         cpu
>    in    cs  us  sy  id
>   102 241247   6  94   0
>   101 240977   5  95   0
>   101 241051   6  94   0
>   101 241176   7  93   0
>
> O(1)-schedule-2.5.2-pre6
>
>   # vmstat 5 | cut -c57-
>      system         cpu
>    in     cs  us  sy  id
>   101 977530  31  69   0
>   101 977478  28  72   0
>   101 977538  27  73   0
>
> the O(1) scheduler is 300% faster, and we do nearly 1 million context
> switches per second!
>
> this test is even more interesting on the 8-way system, running 16
> instances of loop_yield:
>
> vanilla-2.5.2-pre6:
>
>    vmstat 5 | cut -c57-
>       system         cpu
>     in     cs  us  sy  id
>    106 108498   2  98   0
>    101 108333   1  99   0
>    102 108437   1  99   0
>
> 100K/sec context switches - the overhead of the global runqueue makes the
> scheduler slower than the 2-way box!
>
> O(1)-schedule-2.5.2-pre6:
>
>     vmstat 5 | cut -c57-
>      system         cpu
>     in      cs  us  sy  id
>    102 6120358  34  66   0
>    101 6117063  33  67   0
>    101 6117124  34  66   0
>
> this is more than 6 million context switches per second! (i think this is
> a first, no Linux box in existence did so many context switches per second
> before.) This is one workload where the per-CPU runqueues and scalability
> advantages show up big time.
>
> here are the lat_proc and lat_ctx comparisons (the results quoted here are
> the best numbers from a series of tests):
>
> vanilla-2.5.2-pre6:
>
>   ./lat_proc fork
>   Process fork+exit: 440.0000 microseconds
>   ./lat_proc exec
>   Process fork+execve: 491.6364 microseconds
>   ./lat_proc shell
>   Process fork+/bin/sh -c: 3545.0000 microseconds
>
> O(1)-schedule-2.5.2-pre6:
>
>   ./lat_proc fork
>   Process fork+exit: 168.6667 microseconds
>   ./lat_proc exec
>   Process fork+execve: 279.6500 microseconds
>   ./lat_proc shell
>   Process fork+/bin/sh -c: 2874.0000 microseconds
>
> the difference is pretty dramatic - it's mostly due to avoiding much of
> the COW overhead that comes from fork()+execve(). The fork()+exit()
> improvement is mostly due to better CPU affinity - parent and child are
> running on the same CPU, while the old scheduler pushes the child to
> another, idle CPU, which creates heavy interlocking traffic between the MM
> structures.
>
> the compilation benchmarks i ran gave very similar results for both
> schedulers. The O(1) scheduler has a small 2% advantage in make -j
> benchmarks (not accounting statistical noise - it's hard to produce
> reliable compilation benchmarks) - probably due to better SMP affinity
> again.
>
> Status
> ======
>
> i've tested the new scheduler under the aforementioned range of systems
> and workloads, but it's still experimental code nevertheless. I've
> developed it on SMP systems using the 2.5.2-pre kernels, so it has the
> most testing there, but i did a fair number of UP and 2.4.17 tests as
> well. NOTE! For the 2.5.2-pre6 kernel to be usable you should apply
> Andries' latest 2.5.2pre6-kdev_t patch available at:
>
> 	http://www.kernel.org/pub/linux/kernel/people/aeb/
>
> i also tested the RT scheduler for various situations such as
> sched_yield()-ing of RT tasks, strace-ing RT tasks and other details, and
> it's all working as expected. There might be some rough edges though.
>
> Comments, bug reports, suggestions are welcome,
>
> 	Ingo
>
> -
> To unsubscribe from this list: send the line "unsubscribe linux-kernel" in
> the body of a message to majordomo@vger.kernel.org
> More majordomo info at  http://vger.kernel.org/majordomo-info.html
> Please read the FAQ at  http://www.tux.org/lkml/
>


^ permalink raw reply	[flat|nested] 65+ messages in thread
* Re: [announce] [patch] ultra-scalable O(1) SMP and UP scheduler
2002-01-04 2:19 [announce] [patch] ultra-scalable O(1) SMP and UP scheduler Ingo Molnar
` (3 preceding siblings ...)
2002-01-04 14:18 ` Thomas Cataldo
@ 2002-01-04 14:46 ` dan kelley
2002-01-04 17:07 ` Ingo Molnar
2002-01-05 4:33 ` Davide Libenzi
2002-01-07 2:58 ` Rusty Russell
6 siblings, 1 reply; 65+ messages in thread
From: dan kelley @ 2002-01-04 14:46 UTC (permalink / raw)
To: Ingo Molnar; +Cc: linux-kernel@vger.kernel.org
using the 2.4.17 patch against a vanilla 2.4.17 tree, looks like there's a
problem w/ reiserfs:
gcc -D__KERNEL__ -I/usr/src/linux-2.4.17/include -Wall -Wstrict-prototypes
-Wno-trigraphs -O2 -fomit-frame-pointer -fno-strict-aliasing -fno-common
-pipe -mpreferred-stack-boundary=2 -march=i686 -c -o buffer2.o
buffer2.c
buffer2.c: In function `reiserfs_bread':
buffer2.c:54: structure has no member named `context_swtch'
buffer2.c:58: structure has no member named `context_swtch'
make[3]: *** [buffer2.o] Error 1
make[3]: Leaving directory `/usr/src/linux-2.4.17/fs/reiserfs'
make[2]: *** [first_rule] Error 2
make[2]: Leaving directory `/usr/src/linux-2.4.17/fs/reiserfs'
make[1]: *** [_subdir_reiserfs] Error 2
make[1]: Leaving directory `/usr/src/linux-2.4.17/fs'
make: *** [_dir_fs] Error 2
>
> now that new-year's parties are over things are getting boring again. For
> those who want to see and perhaps even try something more complex, i'm
> announcing this patch that is a pretty radical rewrite of the Linux
> scheduler for 2.5.2-pre6:
>
> http://redhat.com/~mingo/O(1)-scheduler/sched-O1-2.5.2-A0.patch
>
> for 2.4.17:
>
> http://redhat.com/~mingo/O(1)-scheduler/sched-O1-2.4.17-A0.patch
>
> Goal
> ====
>
> The main goal of the new scheduler is to keep all the good things we know
> and love about the current Linux scheduler:
>
> - good interactive performance even during high load: if the user
> types or clicks then the system must react instantly and must execute
> the user tasks smoothly, even during considerable background load.
>
> - good scheduling/wakeup performance with 1-2 runnable processes.
>
> - fairness: no process should stay without any timeslice for any
> unreasonable amount of time. No process should get an unjustly high
> amount of CPU time.
>
> - priorities: less important tasks can be started with lower priority,
> more important tasks with higher priority.
>
> - SMP efficiency: no CPU should stay idle if there is work to do.
>
> - SMP affinity: processes which run on one CPU should stay affine to
> that CPU. Processes should not bounce between CPUs too frequently.
>
> - plus additional scheduler features: RT scheduling, CPU binding.
>
> and the goal is also to add a few new things:
>
> - fully O(1) scheduling. Are you tired of the recalculation loop
> blowing the L1 cache away every now and then? Do you think the goodness
> loop is taking a bit too long to finish if there are lots of runnable
> processes? This new scheduler takes no prisoners: wakeup(), schedule(),
> the timer interrupt are all O(1) algorithms. There is no recalculation
> loop. There is no goodness loop either.
>
> - 'perfect' SMP scalability. With the new scheduler there is no 'big'
> runqueue_lock anymore - it's all per-CPU runqueues and locks - two
> tasks on two separate CPUs can wake up, schedule and context-switch
> completely in parallel, without any interlocking. All
> scheduling-relevant data is structured for maximum scalability. (see
> the benchmark section later on.)
>
> - better SMP affinity. The old scheduler has a particular weakness that
> causes the random bouncing of tasks between CPUs if/when higher
> priority/interactive tasks, this was observed and reported by many
> people. The reason is that the timeslice recalculation loop first needs
> every currently running task to consume its timeslice. But when this
> happens on eg. an 8-way system, then this property starves an
> increasing number of CPUs from executing any process. Once the last
> task that has a timeslice left has finished using up that timeslice,
> the recalculation loop is triggered and other CPUs can start executing
> tasks again - after having idled around for a number of timer ticks.
> The more CPUs, the worse this effect.
>
> Furthermore, this same effect causes the bouncing effect as well:
> whenever there is such a 'timeslice squeeze' of the global runqueue,
> idle processors start executing tasks which are not affine to that CPU.
> (because the affine tasks have finished off their timeslices already.)
>
> The new scheduler solves this problem by distributing timeslices on a
> per-CPU basis, without having any global synchronization or
> recalculation.
>
> - batch scheduling. A significant proportion of computing-intensive tasks
> benefit from batch-scheduling, where timeslices are long and processes
> are roundrobin scheduled. The new scheduler does such batch-scheduling
> of the lowest priority tasks - so nice +19 jobs will get
> 'batch-scheduled' automatically. With this scheduler, nice +19 jobs are
> in essence SCHED_IDLE, from an interactiveness point of view.
>
> - handle extreme loads more smoothly, without breakdown and scheduling
> storms.
>
> - O(1) RT scheduling. For those RT folks who are paranoid about the
> O(nr_running) property of the goodness loop and the recalculation loop.
>
> - run fork()ed children before the parent. Andrea has pointed out the
> advantages of this a few months ago, but patches for this feature
> do not work with the old scheduler as well as they should,
> because idle processes often steal the new child before the fork()ing
> CPU gets to execute it.
>
>
> Design
> ======
>
> (those who find the following design issues boring can skip to the next,
> 'Benchmarks' section.)
>
> the core of the new scheduler are the following mechanizms:
>
> - *two*, priority-ordered 'priority arrays' per CPU. There is an 'active'
> array and an 'expired' array. The active array contains all tasks that
> are affine to this CPU and have timeslices left. The expired array
> contains all tasks which have used up their timeslices - but this array
> is kept sorted as well. The active and expired array is not accessed
> directly, it's accessed through two pointers in the per-CPU runqueue
> structure. If all active tasks are used up then we 'switch' the two
> pointers and from now on the ready-to-go (former-) expired array is the
> active array - and the empty active array serves as the new collector
> for expired tasks.
>
> - there is a 64-bit bitmap cache for array indices. Finding the highest
> priority task is thus a matter of two x86 BSFL bit-search instructions.
>
> the split-array solution enables us to have an arbitrary number of active
> and expired tasks, and the recalculation of timeslices can be done
> immediately when the timeslice expires. Because the arrays are always
> access through the pointers in the runqueue, switching the two arrays can
> be done very quickly.
>
> this is a hybride priority-list approach coupled with roundrobin
> scheduling and the array-switch method of distributing timeslices.
>
> - there is a per-task 'load estimator'.
>
> one of the toughest things to get right is good interactive feel during
> heavy system load. While playing with various scheduler variants i found
> that the best interactive feel is achieved not by 'boosting' interactive
> tasks, but by 'punishing' tasks that want to use more CPU time than there
> is available. This method is also much easier to do in an O(1) fashion.
>
> to establish the actual 'load' the task contributes to the system, a
> complex-looking but pretty accurate method is used: there is a 4-entry
> 'history' ringbuffer of the task's activities during the last 4 seconds.
> This ringbuffer is operated without much overhead. The entries tell the
> scheduler a pretty accurate load-history of the task: has it used up more
> CPU time or less during the past N seconds. [the size '4' and the interval
> of 4x 1 seconds was found by lots of experimentation - this part is
> flexible and can be changed in both directions.]
>
> the penalty a task gets for generating more load than the CPU can handle
> is a priority decrease - there is a maximum amount to this penalty
> relative to their static priority, so even fully CPU-bound tasks will
> observe each other's priorities, and will share the CPU accordingly.
>
> I've separated the RT scheduler into a different codebase, while still
> keeping some of the scheduling codebase common. This does not look pretty
> in certain places such as __sched_tail() or activate_task(), but i dont
> think it can be avoided. RT scheduling is different, it uses a global
> runqueue (and global spinlock) and it needs global decisions. To make RT
> scheduling more instant, i've added a broadcast-reschedule message as
> well, to make it absolutely sure that RT tasks of the right priority are
> scheduled apropriately, even on SMP systems. The RT-scheduling part is
> O(1) as well.
>
> the SMP load-balancer can be extended/switched with additional parallel
> computing and cache hierarchy concepts: NUMA scheduling, multi-core CPUs
> can be supported easily by changing the load-balancer. Right now it's
> tuned for my SMP systems.
>
> i skipped the prev->mm == next->mm advantage - no workload i know of shows
> any sensitivity to this. It can be added back by sacrificing O(1)
> schedule() [the current and one-lower priority list can be searched for a
> that->mm == current->mm condition], but costs a fair number of cycles
> during a number of important workloads, so i wanted to avoid this as much
> as possible.
>
> - the SMP idle-task startup code was still racy and the new scheduler
> triggered this. So i streamlined the idle-setup code a bit. We do not call
> into schedule() before all processors have started up fully and all idle
> threads are in place.
>
> - the patch also cleans up a number of aspects of sched.c - moves code
> into other areas of the kernel where it's appropriate, and simplifies
> certain code paths and data constructs. As a result, the new scheduler's
> code is smaller than the old one.
>
> (i'm sure there are other details i forgot to explain. I've commented some
> of the more important code paths and data constructs. If you think some
> aspect of this design is faulty or misses some important issue then please
> let me know.)
>
> (the current code is by no means perfect, my main goal right now, besides
> fixing bugs is to make the code cleaner. Any suggestions for
> simplifications are welcome.)
>
> Benchmarks
> ==========
>
> i've performed two major groups of benchmarks: first i've verified the
> interactive performance (interactive 'feel') of the new scheduler on UP
> and SMP systems as well. While this is a pretty subjective thing, i found
> that the new scheduler is at least as good as the old one in all areas,
> and in a number of high load workloads it feels visibly smoother. I've
> tried a number of workloads, such as make -j background compilation or
> 1000 background processes. Interactive performance can also be verified
> via tracing both schedulers, and i've done that and found no areas of
> missed wakeups or imperfect SMP scheduling latencies in either of the two
> schedulers.
>
> the other group of benchmarks was the actual performance of the scheduler.
> I picked the following ones (some were intentionally picked to load the
> scheduler, others were picked to make the benchmark spectrum more
> complete):
>
> - compilation benchmarks
>
> - thr chat-server workload simulator written by Bill Hartner
>
> - the usual components from the lmbench suite
>
> - a heavily sched_yield()-ing testcode to measure yield() performance.
>
> [ i can test any other workload too that anyone would find interesting. ]
>
> i ran these benchmarks on a 1-CPU box using a UP kernel, a 2-CPU and a
> 8-CPU box as well, using the SMP kernel.
>
> The chat-server simulator creates a number of processes that are connected
> to each other via TCP sockets, the processes send messages to each other
> randomly, in a way that simulates actual chat server designs and
> workloads.
>
> 3 successive runs of './chat_c 127.0.0.1 10 1000' produce the following
> message throughput:
>
> vanilla-2.5.2-pre6:
>
> Average throughput : 110619 messages per second
> Average throughput : 107813 messages per second
> Average throughput : 120558 messages per second
>
> O(1)-schedule-2.5.2-pre6:
>
> Average throughput : 131250 messages per second
> Average throughput : 116333 messages per second
> Average throughput : 179686 messages per second
>
> this is a rougly 20% improvement.
>
> To get all benefits of the new scheduler, i ran it reniced, which in
> essence triggers round-robin batch scheduling for the chat server tasks:
>
> 3 successive runs of 'nice -n 19 ./chat_c 127.0.0.1 10 1000' produce the
> following throughput:
>
> vanilla-2.5.2-pre6:
>
> Average throughput : 77719 messages per second
> Average throughput : 83460 messages per second
> Average throughput : 90029 messages per second
>
> O(1)-schedule-2.5.2-pre6:
>
> Average throughput : 609942 messages per second
> Average throughput : 610221 messages per second
> Average throughput : 609570 messages per second
>
> throughput improved by more than 600%. The UP and 2-way SMP tests show a
> similar edge for the new scheduler. Furthermore, during these chatserver
> tests, the old scheduler doesnt handle interactive tasks very well, and
> the system is very jerky. (which is a side-effect of the overscheduling
> situation the scheduler gets into.)
>
> the 1-CPU UP numbers are interesting as well:
>
> vanilla-2.5.2-pre6:
>
> ./chat_c 127.0.0.1 10 100
> Average throughput : 102885 messages per second
> Average throughput : 95319 messages per second
> Average throughput : 99076 messages per second
>
> nice -n 19 ./chat_c 127.0.0.1 10 1000
> Average throughput : 161205 messages per second
> Average throughput : 151785 messages per second
> Average throughput : 152951 messages per second
>
> O(1)-schedule-2.5.2-pre6:
>
> ./chat_c 127.0.0.1 10 100 # NEW
> Average throughput : 128865 messages per second
> Average throughput : 115240 messages per second
> Average throughput : 99034 messages per second
>
> nice -n 19 ./chat_c 127.0.0.1 10 1000 # NEW
> Average throughput : 163112 messages per second
> Average throughput : 163012 messages per second
> Average throughput : 163652 messages per second
>
> this shows that while on UP we dont have the scalability improvements, the
> O(1) scheduler is still slightly ahead.
>
>
> another benchmark measures sched_yield() performance. (which the pthreads
> code relies on pretty heavily.)
>
> on a 2-way system, starting 4 instances of ./loop_yield gives the
> following context-switch throughput:
>
> vanilla-2.5.2-pre6
>
> # vmstat 5 | cut -c57-
> system cpu
> in cs us sy id
> 102 241247 6 94 0
> 101 240977 5 95 0
> 101 241051 6 94 0
> 101 241176 7 93 0
>
> O(1)-schedule-2.5.2-pre6
>
> # vmstat 5 | cut -c57-
> system cpu
> in cs us sy id
> 101 977530 31 69 0
> 101 977478 28 72 0
> 101 977538 27 73 0
>
> the O(1) scheduler is 300% faster, and we do nearly 1 million context
> switches per second!
>
> this test is even more interesting on the 8-way system, running 16
> instances of loop_yield:
>
> vanilla-2.5.2-pre6:
>
> vmstat 5 | cut -c57-
> system cpu
> in cs us sy id
> 106 108498 2 98 0
> 101 108333 1 99 0
> 102 108437 1 99 0
>
> 100K/sec context switches - the overhead of the global runqueue makes the
> scheduler slower than the 2-way box!
>
> O(1)-schedule-2.5.2-pre6:
>
> vmstat 5 | cut -c57-
> system cpu
> in cs us sy id
> 102 6120358 34 66 0
> 101 6117063 33 67 0
> 101 6117124 34 66 0
>
> this is more than 6 million context switches per second! (i think this is
> a first, no Linux box in existence did so many context switches per second
> before.) This is one workload where the per-CPU runqueues and scalability
> advantages show up big time.
>
> here are the lat_proc and lat_ctx comparisons (the results quoted here are
> the best numbers from a series of tests):
>
> vanilla-2.5.2-pre6:
>
> ./lat_proc fork
> Process fork+exit: 440.0000 microseconds
> ./lat_proc exec
> Process fork+execve: 491.6364 microseconds
> ./lat_proc shell
> Process fork+/bin/sh -c: 3545.0000 microseconds
>
> O(1)-schedule-2.5.2-pre6:
>
> ./lat_proc fork
> Process fork+exit: 168.6667 microseconds
> ./lat_proc exec
> Process fork+execve: 279.6500 microseconds
> ./lat_proc shell
> Process fork+/bin/sh -c: 2874.0000 microseconds
>
> the difference is pretty dramatic - it's mostly due to avoiding much of
> the COW overhead that comes from fork()+execve(). The fork()+exit()
> improvement is mostly due to better CPU affinity - parent and child are
> running on the same CPU, while the old scheduler pushes the child to
> another, idle CPU, which creates heavy interlocking traffic between the MM
> structures.
>
> the compilation benchmarks i ran gave very similar results for both
> schedulers. The O(1) scheduler has a small 2% advantage in make -j
> benchmarks (not accounting statistical noise - it's hard to produce
> reliable compilation benchmarks) - probably due to better SMP affinity
> again.
>
> Status
> ======
>
> i've tested the new scheduler under the aforementioned range of systems
> and workloads, but it's still experimental code nevertheless. I've
> developed it on SMP systems using the 2.5.2-pre kernels, so it has the
> most testing there, but i did a fair number of UP and 2.4.17 tests as
> well. NOTE! For the 2.5.2-pre6 kernel to be usable you should apply
> Andries' latest 2.5.2pre6-kdev_t patch available at:
>
> http://www.kernel.org/pub/linux/kernel/people/aeb/
>
> i also tested the RT scheduler for various situations such as
> sched_yield()-ing of RT tasks, strace-ing RT tasks and other details, and
> it's all working as expected. There might be some rough edges though.
>
> Comments, bug reports, suggestions are welcome,
>
> Ingo
>
> -
> To unsubscribe from this list: send the line "unsubscribe linux-kernel" in
> the body of a message to majordomo@vger.kernel.org
> More majordomo info at http://vger.kernel.org/majordomo-info.html
> Please read the FAQ at http://www.tux.org/lkml/
>
^ permalink raw reply [flat|nested] 65+ messages in thread* Re: [announce] [patch] ultra-scalable O(1) SMP and UP scheduler
2002-01-04 2:19 [announce] [patch] ultra-scalable O(1) SMP and UP scheduler Ingo Molnar
` (4 preceding siblings ...)
2002-01-04 14:46 ` dan kelley
@ 2002-01-05 4:33 ` Davide Libenzi
2002-01-05 20:24 ` Ingo Molnar
2002-01-07 2:58 ` Rusty Russell
6 siblings, 1 reply; 65+ messages in thread
From: Davide Libenzi @ 2002-01-05 4:33 UTC (permalink / raw)
To: Ingo Molnar; +Cc: lkml, Linus Torvalds, Alan Cox
Ingo, i finally had the time to take a look at the code and i've some
comments. I'll start by saying what i like and it is the sched.c cleanup
from the messy condition that suffered by a long time. Then a question,
why the hell are you trying to achieve O(1) inside the single CPU schedulers ?
Once a smart guy said me that only fools never change opinion so i'm not
going to judge you for this, but do you remember 4 years ago when i posted
the priority queue patch what you did say ?
You said, just in case you do not remember, that the load average over a
single CPU even for high loaded servers is typically lower than 5.
So why the hell create 13456 queues to achieve an O(1) on the lookup code
when 70% of the switch cost is switch-mm ?
Yes, 70% of the cost of a context switch is switch-mm, and this measured
with a cycle counter. Take a look at this if you do not believe :
http://www.xmailserver.org/linux-patches/ltcpu.png
More, you removed the MM affinity test that, i agree that is not always
successful, but even if it's able to correctly predict 50% of the
reschedules, it'll be able to save you more then O(1) pickup on a 1..3
runqueue length. Once you've split the queue and removed the common lock
you reduced _a_lot_ the scheduler cost for the SMP case and inside the
local CPU you don't need O(1) pickups.
Why ?
Look at how many people suffered the current scheduler performances for
the UP case. Noone. People posted patches to get O(1) pickups ( yep, even
me ), guys tried them believing that these would have solved their
problems and noone requested a merge because the current scheduler
architecture is just OK for the uniprocessor case.
Lets come at the code. Have you ever tried to measure the context switch
times for standard tasks when there's an RT tasks running ?
Every time an RT run, every task on other CPUs will try to pickup a task
inside the RT queue :
if (unlikely(rt_array.nr_active))
if (rt_schedule())
goto out_return;
and more, inside the rt_schedule() you're going to get the full lock set :
lock_rt();
...
static void lock_rt(void)
{
int i;
__cli();
for (i = 0; i < smp_num_cpus; i++)
spin_lock(&cpu_rq(i)->lock);
spin_lock(&rt_lock);
}
with disabled interrupts. More the wakeup code for RT task is, let's say,
at least sub-optimal :
if (unlikely(rt_task(p))) {
spin_lock(&rt_lock);
enqueue_task(p, &rt_array);
>> smp_send_reschedule_all();
current->need_resched = 1;
spin_unlock(&rt_lock);
}
You basically broadcast IPIs with all other CPUs falling down to get the
whole lock set. I let you imagine what happens. The load estimator is both
complex, expensive ( mult, divs, mods ) and does not work :
static inline void update_sleep_avg_deactivate(task_t *p)
{
unsigned int idx;
unsigned long j = jiffies, last_sample = p->run_timestamp / HZ,
curr_sample = j / HZ, delta = curr_sample - last_sample;
if (delta) {
if (delta < SLEEP_HIST_SIZE) {
for (idx = 0; idx < delta; idx++) {
p->sleep_idx++;
p->sleep_idx %= SLEEP_HIST_SIZE;
p->sleep_hist[p->sleep_idx] = 0;
}
} else {
for (idx = 0; idx < SLEEP_HIST_SIZE; idx++)
p->sleep_hist[idx] = 0;
p->sleep_idx = 0;
}
}
p->sleep_timestamp = j;
}
If you scale down to seconds with /HZ, delta will be 99.99% of cases zero.
How much do you think a task will run 1-3 seconds ?!?
You basically shortened the schedule() path by adding more code on the
wakeup() path. This :
static inline unsigned int update_sleep_avg_activate(task_t *p)
{
unsigned int idx;
unsigned long j = jiffies, last_sample = p->sleep_timestamp / HZ,
curr_sample = j / HZ, delta = curr_sample - last_sample,
delta_ticks, sum = 0;
if (delta) {
if (delta < SLEEP_HIST_SIZE) {
p->sleep_hist[p->sleep_idx] += HZ - (p->sleep_timestamp % HZ);
p->sleep_idx++;
p->sleep_idx %= SLEEP_HIST_SIZE;
for (idx = 1; idx < delta; idx++) {
p->sleep_idx++;
p->sleep_idx %= SLEEP_HIST_SIZE;
p->sleep_hist[p->sleep_idx] = HZ;
}
} else {
for (idx = 0; idx < SLEEP_HIST_SIZE; idx++)
p->sleep_hist[idx] = HZ;
p->sleep_idx = 0;
}
p->sleep_hist[p->sleep_idx] = 0;
delta_ticks = j % HZ;
} else
delta_ticks = j - p->sleep_timestamp;
p->sleep_hist[p->sleep_idx] += delta_ticks;
p->run_timestamp = j;
for (idx = 0; idx < SLEEP_HIST_SIZE; idx++)
sum += p->sleep_hist[idx];
return sum * HZ / ((SLEEP_HIST_SIZE-1)*HZ + (j % HZ));
}
plus this :
#define MAX_BOOST (MAX_PRIO/3)
sleep = update_sleep_avg_activate(p);
load = HZ - sleep;
penalty = (MAX_BOOST * load)/HZ;
if (penalty) {
p->prio = NICE_TO_PRIO(p->__nice) + penalty;
if (p->prio < 0)
p->prio = 0;
if (p->prio > MAX_PRIO-1)
p->prio = MAX_PRIO-1;
}
cannot be defined a short path inside wakeup().
Even the expire task, that is called at HZ frequency is not that short :
void expire_task(task_t *p)
{
runqueue_t *rq = this_rq();
unsigned long flags;
if (rt_task(p)) {
if ((p->policy == SCHED_RR) && p->time_slice) {
spin_lock_irqsave(&rq->lock, flags);
spin_lock(&rt_lock);
if (!--p->time_slice) {
/*
* RR tasks get put to the end of the
* runqueue when their timeslice expires.
*/
dequeue_task(p, &rt_array);
enqueue_task(p, &rt_array);
p->time_slice = RT_PRIO_TO_TIMESLICE(p->prio);
p->need_resched = 1;
}
spin_unlock(&rt_lock);
spin_unlock_irqrestore(&rq->lock, flags);
}
return;
}
if (p->array != rq->active) {
p->need_resched = 1;
return;
}
/*
* The task cannot change CPUs because it's the current task.
*/
spin_lock_irqsave(&rq->lock, flags);
if (!--p->time_slice) {
p->need_resched = 1;
p->time_slice = PRIO_TO_TIMESLICE(p->prio);
/*
* Timeslice used up - discard any possible
* priority penalty:
*/
dequeue_task(p, rq->active);
enqueue_task(p, rq->expired);
} else {
/*
* Deactivate + activate the task so that the
* load estimator gets updated properly:
*/
deactivate_task(p, rq);
activate_task(p, rq);
}
load_balance(rq);
spin_unlock_irqrestore(&rq->lock, flags);
}
with a runqueue balance done at every timer tick.
Another thing that i'd like to let you note is that with the current
2.5.2-preX scheduler the recalculation loop is no more a problem
because it's done only for running tasks and the lock switch between
task_list and runqueue has been removed. This is just fine because if you
consider the worst case for the recalc loop frequency is one CPU bound
task running. In this case the frequency is about 1/TS ~= 20 and it's done
only for one task. If you've two CPU bound tasks runnning the frequency
will become about 1/(2 * TS) ~= 10 ( recalc two tasks ). With the modified
2.5.2-preX has been cut _a_lot_ the recalculation loop cost and, while
before on my machine i was able to clearly distinguish recalc loop
LatSched samples ( ~= 40000 cycles with about 120 processes ), now the
context switch cost is uniform over the time ( no random peaks to 40000 cycles ).
Anyway, it's the balancing code that will make the _real_world_ tests
difference on a multi queue scheduler, not O(1) pickups.
- Davide
^ permalink raw reply [flat|nested] 65+ messages in thread* Re: [announce] [patch] ultra-scalable O(1) SMP and UP scheduler
2002-01-05 4:33 ` Davide Libenzi
@ 2002-01-05 20:24 ` Ingo Molnar
2002-01-05 19:49 ` Mika Liljeberg
2002-01-05 23:04 ` Davide Libenzi
0 siblings, 2 replies; 65+ messages in thread
From: Ingo Molnar @ 2002-01-05 20:24 UTC (permalink / raw)
To: Davide Libenzi; +Cc: lkml, Linus Torvalds, Alan Cox
On Fri, 4 Jan 2002, Davide Libenzi wrote:
> [...] but do you remember 4 years ago when i posted the priority queue
> patch what you did say ? You said, just in case you do not remember,
> that the load average over a single CPU even for high loaded servers
> is typically lower than 5.
yep, this might have been the case 4 years ago :) But i'd not be ashamed
to change my opinion even if i had said it just a few months ago.
Today we have things like the slashdot effect that will break down
otherwise healthy and well-sized systems. People have started working
around things by designing servers that run only a limited number of
processes, but the fact is, why should we restrict application maker's
choice of design, especially if they are often interested in robustness
more than in the last bit of performance. There are a fair number of
real-world application servers that start to suffer under Linux if put
under realistic load.
> Yes, 70% of the cost of a context switch is switch-mm, and this
> measured with a cycle counter. [...]
two-process context switch times under the O(1) scheduler did not get
slower.
> Take a look at this if you do not believe :
In fact it's the cr3 switch (movl %0, %%cr3) that accounts for about 30%
of the context switch cost. On x86. On other architectures it's often
much, much cheaper.
> More, you removed the MM affinity test that, i agree that is not
> always successful, but even if it's able to correctly predict 50% of
> the reschedules, [...]
you must be living on a different planet if you say that the p->mm test in
goodness() matters in 50% of the reschedules. In my traces it was more
like 1% of the cases or less, so i removed it as insignificant factor
causing significant complexity. Please quote the specific workload/test i
should try, where you think the mm test matters.
> Lets come at the code. Have you ever tried to measure the context
> switch times for standard tasks when there's an RT tasks running ?
the current RT scheduling scheme was a conscious choice. *If* a RT task is
running (which just doesnt happen in 99.999% of the time) then scalability
becomes much less important, and scheduling latency is the only and
commanding factor.
> You basically broadcast IPIs with all other CPUs falling down to get
> the whole lock set. [...]
oh yes. *If* a RT task becomes runnable then i *want* all other CPUs drop
all the work they have as soon as possible and go try to run that
over-important RT task. It doesnt matter whether it's SMP-affine, and it
doesnt matter whether it's scalable. RT is about latency of action,
nothing else. RT is about a robot arm having to stop in 100 msecs or the
product gets physically damaged.
this method of 'global RT tasks' has the following practical advantage: it
reduces the statistical scheduling latency of RT tasks better than any
other solution, because the scheduler *cannot* know in advance which CPU
will be able to get the RT task first. Think about it, what if the CPU,
that appears to be the least busy for the scheduler, happens to be
spinning within some critical section? The best method is to let every CPU
go into the scheduler as fast as possible, and let the fastest one win.
George Anzinger @ Montavista has suggested the following extension to this
concept: besides having such global RT tasks, for some RT usages it makes
sense to have per-CPU 'affine' RT tasks. I think that makes alot of sense
as well, because if you care more about scalability than latencies, then
you can still flag your process to be 'CPU affine RT task', which wont be
included in the global queue, and thus you wont see the global locking
overhead and 'CPUs racing to run RT tasks'. I have reserved some priority
bitspace for such purposes.
> static inline void update_sleep_avg_deactivate(task_t *p)
> {
> unsigned int idx;
> unsigned long j = jiffies, last_sample = p->run_timestamp / HZ,
> curr_sample = j / HZ, delta = curr_sample - last_sample;
>
> if (delta) {
[...]
> If you scale down to seconds with /HZ, delta will be 99.99% of cases
> zero. How much do you think a task will run 1-3 seconds ?!?
i have to say that you apparently do not understand the code. Please check
it out again, it does not do what you think it does. The code measures the
portion of time the task spends in the runqueue. Eg. a fully CPU-bound
task spends 100% of its time on the runqueue. A task that is sleeping
spends 0% of its time on the runqueue. A task that does some real work and
goes on and off the runqueue will have a 'runqueue percentage value'
somewhere between the two. The load estimator in the O(1) scheduler
measures this value based on a 4-entry, 4 seconds 'runqueue history'. The
scheduler uses this percentage value to decide whether a task is
'interactive' or a 'CPU hog'. But you do not have to take my word for it,
check out the code and prove me wrong.
> You basically shortened the schedule() path by adding more code on the
> wakeup() path. This :
would you mind proving this claim with hard numbers? I *have* put up hard
numbers, but i dont see measurements in your post. I was very careful
about not making wakeup() more expensive at the expense of schedule(). The
load estimator was written and tuned carefully, and eg. on UP, switching
just 2 tasks (lat_ctx -s 0 2), the O(1) scheduler is as fast as the
2.5.2-pre6/pre7 scheduler. It also brings additional benefits of improved
interactiveness detection, which i'd be willing to pay the price for even
if it made scheduling slightly more expensive. (which it doesnt.)
> with a runqueue balance done at every timer tick.
please prove that this has any measurable performance impact. Right now
the load-balancer is a bit over-eager trying to balance work - in the -A2
patch i've relaxed this a bit.
if you check out the code then you'll see that the load-balancer has been
designed to be scalable and SMP-friendly as well: ie. it does not lock
other runqueues while it checks the statistics, so it does not create
interlocking traffic. It only goes and locks other runqueues *if* it finds
an imbalance. Ie., under this design, it's perfectly OK to run the load
balancer 100 times a second, because there wont be much overhead unless
there is heavy runqueue activity.
(in my current codebase i've changed the load-balancer to be called with a
maximum frequency of 100 - eg. if HZ is set to 1000 then we still call the
load balancer only 100 times a second.)
> Another thing that i'd like to let you note is that with the current
> 2.5.2-preX scheduler the recalculation loop is no more a problem
> because it's done only for running tasks and the lock switch between
> task_list and runqueue has been removed. [...]
all the comparisons i did and descriptions i made were based on the
current 2.5.2-pre6/pre7 scheduler. The benchmarks i did were against
2.5.2-pre6 that has the latest code. But to make the comparison more fair,
i'd like to ask you to compare your multiqueue scheduler patch against the
O(1) scheduler, and post your results here.
and yes, the goodness() loop does matter very much. I have fixed this, and
unless you can point out practical disadvantages i dont understand your
point.
fact is, scheduler design does matter when things are turning for the
worse, when your website gets a sudden spike of hits and you still want to
use the system's resources to handle (and thus decrease) the load and not
waste it on things like goodness loops which will only make the situation
worse. There is no system that cannot be overloaded, but there is a big
difference between handling overloads gracefully and trying to cope with
load spikes or falling flat on our face spending 90% of our time in the
scheduler. This is why i think it's a good idea to have an O(1)
scheduler.
Ingo
^ permalink raw reply [flat|nested] 65+ messages in thread* Re: [announce] [patch] ultra-scalable O(1) SMP and UP scheduler
2002-01-05 20:24 ` Ingo Molnar
@ 2002-01-05 19:49 ` Mika Liljeberg
2002-01-05 22:00 ` Ingo Molnar
2002-01-05 23:04 ` Davide Libenzi
1 sibling, 1 reply; 65+ messages in thread
From: Mika Liljeberg @ 2002-01-05 19:49 UTC (permalink / raw)
To: mingo; +Cc: Davide Libenzi, lkml, Linus Torvalds, Alan Cox
Ingo Molnar wrote:
> this method of 'global RT tasks' has the following practical advantage: it
> reduces the statistical scheduling latency of RT tasks better than any
> other solution, because the scheduler *cannot* know in advance which CPU
> will be able to get the RT task first. Think about it, what if the CPU,
> that appears to be the least busy for the scheduler, happens to be
> spinning within some critical section? The best method is to let every CPU
> go into the scheduler as fast as possible, and let the fastest one win.
Well, different RT tasks have different requirements and when multiple
RT tasks are competing for the CPUs it gets more interesting. For
instance, suppose that I have the MAC protocol for a software radio
running on a dedicated CPU, clocking out a radio frame every 1 ms with
very high time synchronization requirements. For this application I
definately don't want my CPU suddenly racing to the door to see why the
doorbell rang. :) This seems to suggest that it should be possible for a
task to make itself non-interruptible, in which case it would not even
receive reschedule IPIs for the global RT tasks.
It also seems to me that when the number of CPUs gets higher, the
average latency improvent gained for each additional CPU gets less and
less. Perhaps for SMP systems with a high number of CPUs it would be
more scalable to only interrupt a subset of the CPUs for the RT tasks in
the global queue.
> George Anzinger @ Montavista has suggested the following extension to this
> concept: besides having such global RT tasks, for some RT usages it makes
> sense to have per-CPU 'affine' RT tasks. I think that makes alot of sense
> as well, because if you care more about scalability than latencies, then
> you can still flag your process to be 'CPU affine RT task', which wont be
> included in the global queue, and thus you wont see the global locking
> overhead and 'CPUs racing to run RT tasks'. I have reserved some priority
> bitspace for such purposes.
This sounds like the very thing, although I think that key word here is
"non-interruptible" rather than just "CPU-affine". If this is what you
meant, I apologize for wasting everybody's time.
Regards,
MikaL
^ permalink raw reply [flat|nested] 65+ messages in thread
* Re: [announce] [patch] ultra-scalable O(1) SMP and UP scheduler
  2002-01-05 19:49     ` Mika Liljeberg
@ 2002-01-05 22:00       ` Ingo Molnar
  2002-01-05 21:04         ` Mika Liljeberg
  0 siblings, 1 reply; 65+ messages in thread
From: Ingo Molnar @ 2002-01-05 22:00 UTC (permalink / raw)
  To: Mika Liljeberg; +Cc: Davide Libenzi, lkml, Linus Torvalds, Alan Cox


On Sat, 5 Jan 2002, Mika Liljeberg wrote:

> Well, different RT tasks have different requirements and when multiple
> RT tasks are competing for the CPUs it gets more interesting. For
> instance, suppose that I have the MAC protocol for a software radio
> running on a dedicated CPU, clocking out a radio frame every 1 ms with
> very high time synchronization requirements. For this application I
> definately don't want my CPU suddenly racing to the door to see why
> the doorbell rang. :) This seems to suggest that it should be possible
> for a task to make itself non-interruptible, in which case it would
> not even receive reschedule IPIs for the global RT tasks.

yes, we can do the following: instead of sending the broadcast IPI, we can
skip CPUs that run a RT task that has a higher priority than the one that
just got woken up. This way we send the IPI only to CPUs that have a
chance to actually preempt their current task for the newly woken up task.
We do this optimization for SCHED_OTHER tasks already, behavior like this
is not something cast into stone.

this way you can mark your RT task 'uninterruptible' by giving it a high
RT priority.

i'd also like to note that Davide's description made the broadcast IPI
solution sound more scary than it is in fact. A broadcast IPI's handler is
pretty lightweight (it does a single APIC ACK and returns), and even a
pointless trip into the O(1) scheduler wont take more time than say 10-20
microseconds (pessimistic calculation), on a typical x86 system.

and there is another solution as well, we could simply pick a single CPU
where the RT task preempts the current task, and send a directed IPI. This
is similar to the reschedule_idle() code.

The reason i made the IPI a broadcast in the RT case is race avoidance:
right now our IPIs are 'inexact', ie. if the scheduling situation changes
while they are in flight (they can take 5-10 microseconds to get delivered
to the target) then they might hit the wrong target. In case of RT/SMP,
this might end up us missing to run a task that should be run. This was
the major reason why i took the broadcast IPI solution. Eg. consider the
following situation: we have 4 runnable RT tasks, two have priority 20,
the other two have a higher RT priority of 90. We do not want to end up
with this situation:

	CPU#0					CPU#1
        prio 90 task running			prio 20 task running
	prio 90 task pending			prio 20 task pending

because the pending prio 90 task should run on CPU#1:

	CPU#0					CPU#1
        prio 90 task running			prio 90 task running
	prio 20 task pending			prio 20 task pending

situations like this is the main reason why i made the RT scheduler use
heavier locking and more conservative constructs, like broadcast IPIs.

	Ingo


^ permalink raw reply	[flat|nested] 65+ messages in thread
* Re: [announce] [patch] ultra-scalable O(1) SMP and UP scheduler
2002-01-05 22:00 ` Ingo Molnar
@ 2002-01-05 21:04 ` Mika Liljeberg
0 siblings, 0 replies; 65+ messages in thread
From: Mika Liljeberg @ 2002-01-05 21:04 UTC (permalink / raw)
To: mingo; +Cc: Davide Libenzi, lkml, Linus Torvalds, Alan Cox
Ingo Molnar wrote:
> yes, we can do the following: instead of sending the broadcast IPI, we can
> skip CPUs that run a RT task that has a higher priority than the one that
> just got woken up. This way we send the IPI only to CPUs that have a
> chance to actually preempt their current task for the newly woken up task.
> We do this optimization for SCHED_OTHER tasks already, behavior like this
> is not something cast into stone.
>
> this way you can mark your RT task 'uninterruptible' by giving it a high
> RT priority.
This is sort of what I was thinking, although it makes it more expensive
to determine to IPI mask. A very light weight alternative could be to
make only the highest priority RT tasks uninterruptible. If a CPU is
busy with one of these it can simply be taken out of the global group
for the duration. If a task is worried about interruptions, it can boost
its prio to max for the critical part and the return it to normal
afterwards.
> i'd also like to note that Davide's description made the broadcast IPI
> solution sound more scary than it is in fact. A broadcast IPI's handler is
> pretty lightweight (it does a single APIC ACK and returns), and even a
> pointless trip into the O(1) scheduler wont take more time than say 10-20
> microseconds (pessimistic calculation), on a typical x86 system.
I guess the worry is that the overhead isn't bounded and the per-CPU
overhead increases with the number of CPUs. If the interrupts happen
come in a burst, a running task can experience a longer interruption.
> The reason i made the IPI a broadcast in the RT case is race avoidance:
> right now our IPIs are 'inexact', ie. if the scheduling situation changes
> while they are in flight (they can take 5-10 microseconds to get delivered
> to the target) then they might hit the wrong target. In case of RT/SMP,
> this might end up us missing to run a task that should be run. This was
> the major reason why i took the broadcast IPI solution.
I see your point. I may be getting off base here, but how does the cost
of making the IPIs exact compare to the cost of using broadcast IPIs on
an n-way machine (depends on n I suppose)?
Regards,
MikaL
^ permalink raw reply [flat|nested] 65+ messages in thread
* Re: [announce] [patch] ultra-scalable O(1) SMP and UP scheduler
  2002-01-05 20:24   ` Ingo Molnar
  2002-01-05 19:49     ` Mika Liljeberg
@ 2002-01-05 23:04     ` Davide Libenzi
  2002-01-05 23:41       ` Alan Cox
                         ` (2 more replies)
  1 sibling, 3 replies; 65+ messages in thread
From: Davide Libenzi @ 2002-01-05 23:04 UTC (permalink / raw)
  To: Ingo Molnar; +Cc: lkml, Linus Torvalds, Alan Cox

On Sat, 5 Jan 2002, Ingo Molnar wrote:

>
> On Fri, 4 Jan 2002, Davide Libenzi wrote:
>
> > [...] but do you remember 4 years ago when i posted the priority queue
> > patch what you did say ? You said, just in case you do not remember,
> > that the load average over a single CPU even for high loaded servers
> > is typically lower than 5.
>
> yep, this might have been the case 4 years ago :) But i'd not be ashamed
> to change my opinion even if i had said it just a few months ago.
>
> Today we have things like the slashdot effect that will break down
> otherwise healthy and well-sized systems. People have started working
> around things by designing servers that run only a limited number of
> processes, but the fact is, why should we restrict application maker's
> choice of design, especially if they are often interested in robustness
> more than in the last bit of performance. There are a fair number of
> real-world application servers that start to suffer under Linux if put
> under realistic load.

No Ingo the fact that you coded the patch this time does not really change
the workloads, once you've a per-cpu run queue and lock. The thing that
makes big servers to suffer in the common queue plus the cache coherency
traffic due the common lock. Look here for an 8 way system :

http://www.xmailserver.org/linux-patches/lats8-latsch.png

In even _high_realistic_ workloads on these servers the scheduler impact
is never more than 5-15% and by simply splitting the queue/lock you get a
30 up to 60 time fold ( see picture ), that makes the scheduler impact to
go down to 0.2-0.3%. Why do you need to overoptimize for a 0.2% ?


> > Yes, 70% of the cost of a context switch is switch-mm, and this
> > measured with a cycle counter. [...]
>
> two-process context switch times under the O(1) scheduler did not get
> slower.

No makes the scheduler more complex and with a bigger memory footprint.
It's a classical example of overoptimization that you agreed time ago to
be unnecessary. By having coded the patch this time seems to have changed
your mind :

/*
 *  linux/kernel/sched.c
 *
 *  Kernel scheduler and related syscalls
 *
 *  Copyright (C) 1991, 1992, 2002  Linus Torvalds, Ingo Molnar
 *


> > Take a look at this if you do not believe :
>
> In fact it's the cr3 switch (movl %0, %%cr3) that accounts for about 30%
> of the context switch cost. On x86. On other architectures it's often
> much, much cheaper.

TLB flushes are expensive everywhere, and you know exactly this and if you
used a cycle counter to analyze the scheduler instead of silly benchmarks
you would probably know more about what inside a context switch does matter.
Just to give you an example, the cost of a context switch :

CS = CMC + MMC + N * GLC

with :

CMC = common path cost
MMC = switch MM cost
N   = number of tasks on the run queue
GLC = cost of a goodness() loop

Do you know what is, in my machine, the value of  N  that makes :

CMC + MMC = N * GLC

Well, it's 10-12, that means a runqueue with 10-12 running processes.
What does this mean, it means that is almost useless to optmize for O(1)
because (CMC + MMC) is about one order of magnitude about GLC.
And a run queue of 10 is HUGE for a single CPU, as long a run queue of 80
is again pretty HUGE for an 8 way SMP system.
And you've the history on Linux of the last 10 years that thought you that
such run queue are not realistic.


> > More, you removed the MM affinity test that, i agree that is not
> > always successful, but even if it's able to correctly predict 50% of
> > the reschedules, [...]
>
> you must be living on a different planet if you say that the p->mm test in
> goodness() matters in 50% of the reschedules. In my traces it was more
> like 1% of the cases or less, so i removed it as insignificant factor
> causing significant complexity. Please quote the specific workload/test i
> should try, where you think the mm test matters.

Oh sure you won't see this in benchmarks that but try to run a cycle
sampler with a yield()-test load and move your mouse. Look at the
context switch time when yield() tasks are switching and when the keventd
task get kicked. I'm not saying that the test will be always successful
but getting right even a percent of these switches is sure better than
trying to optimize a cost that is limited by way higher components.


> > Lets come at the code. Have you ever tried to measure the context
> > switch times for standard tasks when there's an RT tasks running ?
>
> the current RT scheduling scheme was a conscious choice. *If* a RT task is
> running (which just doesnt happen in 99.999% of the time) then scalability
> becomes much less important, and scheduling latency is the only and
> commanding factor.
> > You basically broadcast IPIs with all other CPUs falling down to get
> > the whole lock set. [...]
>
> oh yes. *If* a RT task becomes runnable then i *want* all other CPUs drop
> all the work they have as soon as possible and go try to run that
> over-important RT task. It doesnt matter whether it's SMP-affine, and it
> doesnt matter whether it's scalable. RT is about latency of action,
> nothing else. RT is about a robot arm having to stop in 100 msecs or the
> product gets physically damaged.
>
> this method of 'global RT tasks' has the following practical advantage: it
> reduces the statistical scheduling latency of RT tasks better than any
> other solution, because the scheduler *cannot* know in advance which CPU
> will be able to get the RT task first. Think about it, what if the CPU,
> that appears to be the least busy for the scheduler, happens to be
> spinning within some critical section? The best method is to let every CPU
> go into the scheduler as fast as possible, and let the fastest one win.

Ingo your RT code sucks and if you for a single second try to forget that
you coded the patch, you will be able to agree. The full lock acquisition
sucks, the broadcast IPI sucks ( just to not exaggerate ) and the fact
that while an RT task is running and the schedules that happens in the
system will try to pickup inside the RT queue ( trying to acquire the
whole lock set, each time ). Come on Ingo this looks very like the old
wakeup code before the wakeone has been implemented. There is absolutely
no reason that, in an 4/8 way smp system running an rt task on a cpu, the
other 3/7 should suffer for this. Try to open your eyes Ingo, you would
never accepted this code if it was coming from someone else.


> George Anzinger @ Montavista has suggested the following extension to this
> concept: besides having such global RT tasks, for some RT usages it makes
> sense to have per-CPU 'affine' RT tasks. I think that makes alot of sense
> as well, because if you care more about scalability than latencies, then
> you can still flag your process to be 'CPU affine RT task', which wont be
> included in the global queue, and thus you wont see the global locking
> overhead and 'CPUs racing to run RT tasks'. I have reserved some priority
> bitspace for such purposes.

I don't like to infringe patents but this is used inside the Balanced
Multi Queue Scheduler from the very beginning. A flag SCHED_RTLOCAL in
setscheduler() makes the difference.


> > static inline void update_sleep_avg_deactivate(task_t *p)
> > {
> >     unsigned int idx;
> >     unsigned long j = jiffies, last_sample = p->run_timestamp / HZ,
> >         curr_sample = j / HZ, delta = curr_sample - last_sample;
> >
> >     if (delta) {
> [...]
>
> > If you scale down to seconds with /HZ, delta will be 99.99% of cases
> > zero. How much do you think a task will run 1-3 seconds ?!?
>
> i have to say that you apparently do not understand the code. Please check
> it out again, it does not do what you think it does. The code measures the
> portion of time the task spends in the runqueue. Eg. a fully CPU-bound
> task spends 100% of its time on the runqueue. A task that is sleeping
> spends 0% of its time on the runqueue. A task that does some real work and
> goes on and off the runqueue will have a 'runqueue percentage value'
> somewhere between the two. The load estimator in the O(1) scheduler
> measures this value based on a 4-entry, 4 seconds 'runqueue history'. The
> scheduler uses this percentage value to decide whether a task is
> 'interactive' or a 'CPU hog'. But you do not have to take my word for it,
> check out the code and prove me wrong.

I'm sorry but you set  p->run_timestamp  to jiffies when the task is run
and you make  curr_sample = j / HZ when it stops running.
If you divide by HZ you'll obtain seconds. A task typically runs 10ms to
60ms that means that, for example :

p->run_timestamp = N       ( jiffies )
curr_sample      = N+5 max ( jiffies )

with HZ == 100 ( different HZ does not change the picture ).
Now, if you divide by HZ, what do you obtain ?

   unsigned long j = jiffies, last_sample = p->run_timestamp / HZ,
        curr_sample = j / HZ, delta = curr_sample - last_sample;

delta will be ~97% always zero, and the remaining 3% one ( because of HZ
scale crossing ).
Now this is not my code but do you understand your code ?
Do you understand why it's broken ?


> > You basically shortened the schedule() path by adding more code on the
> > wakeup() path. This :
>
> would you mind proving this claim with hard numbers? I *have* put up hard
> numbers, but i dont see measurements in your post. I was very careful
> about not making wakeup() more expensive at the expense of schedule(). The
> load estimator was written and tuned carefully, and eg. on UP, switching
> just 2 tasks (lat_ctx -s 0 2), the O(1) scheduler is as fast as the
> 2.5.2-pre6/pre7 scheduler. It also brings additional benefits of improved
> interactiveness detection, which i'd be willing to pay the price for even
> if it made scheduling slightly more expensive. (which it doesnt.)

Oh, you've very likely seens my posts and they're filled of numbers :

http://www.xmailserver.org/linux-patches/mss.html
http://www.xmailserver.org/linux-patches/mss-2.html

And the study, being based on cycle counter measures is a little bit more
accurate than vmstat. And if you'd have used a cycle counter you'd have
probably seen where the cost of a context switch is and you'd have
probably worked trying to optimize something else instead of a goodness()
loop.


> > with a runqueue balance done at every timer tick.
>
> please prove that this has any measurable performance impact. Right now
> the load-balancer is a bit over-eager trying to balance work - in the -A2
> patch i've relaxed this a bit.
>
> if you check out the code then you'll see that the load-balancer has been
> designed to be scalable and SMP-friendly as well: ie. it does not lock
> other runqueues while it checks the statistics, so it does not create
> interlocking traffic. It only goes and locks other runqueues *if* it finds
> an imbalance. Ie., under this design, it's perfectly OK to run the load
> balancer 100 times a second, because there wont be much overhead unless
> there is heavy runqueue activity.
>
> (in my current codebase i've changed the load-balancer to be called with a
> maximum frequency of 100 - eg. if HZ is set to 1000 then we still call the
> load balancer only 100 times a second.)

Wow, only 100 times, it's pretty good. You're travelling between the CPU
data only 100 times per second probably trashing the running process cache
image, but overall it's pretty good code.
And please do not say me to measure something like this. This is that kind
of overload that you add to a system that will make you wake up one
morning with a bloated system without even being able to understand from
where it comes. You would never have been accepted a patch like this one
Ingo, don't try to sell it as good because you coded it.


> > Another thing that i'd like to let you note is that with the current
> > 2.5.2-preX scheduler the recalculation loop is no more a problem
> > because it's done only for running tasks and the lock switch between
> > task_list and runqueue has been removed. [...]
>
> all the comparisons i did and descriptions i made were based on the
> current 2.5.2-pre6/pre7 scheduler. The benchmarks i did were against
> 2.5.2-pre6 that has the latest code. But to make the comparison more fair,
> i'd like to ask you to compare your multiqueue scheduler patch against the
> O(1) scheduler, and post your results here.
>
> and yes, the goodness() loop does matter very much. I have fixed this, and
> unless you can point out practical disadvantages i dont understand your
> point.

What ? making the scheduler switch 60000000 times per seconds with 1245
tasks on the run queue ?! Please Ingo.
I did not seek this. I seeked this 4 years ago when you ( that did
not code the patch ) were on the other side saying that is useless to
optimize for O(1) because realistic run queue are < 5 / CPU. Do you
remember Ingo ?
Adding a multi level priority is no more than 10 minutes of code inside
BMQS but i thought it was useless and i did not code it. Even a dual queue
+ FIFO pickups :

http://www.xmailserver.org/linux-patches/mss-2.html#dualqueue

can get O(1) w/out code complexity but i did not code it. Two days ago
George Anziger proposed me to implement ( inside BMQS ) __exactly__ the
same thing that you implemented/copied ( and that he did implement before
you in his scheduler ) but i said to George my opinion about that, and George
can confirm this.


> fact is, scheduler design does matter when things are turning for the
> worse, when your website gets a sudden spike of hits and you still want to
> use the system's resources to handle (and thus decrease) the load and not
> waste it on things like goodness loops which will only make the situation
> worse. There is no system that cannot be overloaded, but there is a big
> difference between handling overloads gracefully and trying to cope with
> load spikes or falling flat on our face spending 90% of our time in the
> scheduler. This is why i think it's a good idea to have an O(1)
> scheduler.

Ingo please, this is too much even for a guy that changed his opinion. 90%
of the time spent inside the scheduler. You know what makes me angry ?
It's not that you can sell this stuff to guys that knows how things works
in a kernel, i'm getting angry because i think about guys actually reading
your words and that really think that using an O(1) scheduler can change
their life/system-problems. And they're going to spend their time trying
this stuff.
Again, the history of our UP scheduler thought us that noone has been able
to makes it suffer with realistic/high not-stupid-benchamrks loads.
Look, at the contrary of you ( that seem to want to sell your code ), i
simply want a better Linux scheduler w/out overoptimizations useful only
to grab the attention inside advertising inserts.
I give you credit to have cleaned sched.c but the guidelines for me are :

1) multi queue/lock
2) current dyn_prio/time_slice implementation ( the one in pre8 )
3) current lookup, that becomes simpler inside the CPU local run queue :

    list_for_each(tmp, head) {
        p = list_entry(tmp, struct task_struct, run_list);
        if ((weight = goodness(p, prev->active_mm)) > c)
            c = weight, next = p;
    }

4) current recalc loop logic
5) _definitely_ better RT code

If we agree here we can continue working on the same code base otherwise
i'll go ahead with my work ( well it's more fun than work since my salary
in completely independent from this ).


- Davide


^ permalink raw reply	[flat|nested] 65+ messages in thread
* Re: [announce] [patch] ultra-scalable O(1) SMP and UP scheduler
2002-01-05 23:04 ` Davide Libenzi
@ 2002-01-05 23:41 ` Alan Cox
2002-01-05 23:46 ` Davide Libenzi
2002-01-06 0:47 ` Linus Torvalds
2002-01-06 2:49 ` Ingo Molnar
2 siblings, 1 reply; 65+ messages in thread
From: Alan Cox @ 2002-01-05 23:41 UTC (permalink / raw)
To: Davide Libenzi; +Cc: Ingo Molnar, lkml, Linus Torvalds, Alan Cox
> > In fact it's the cr3 switch (movl %0, %%cr3) that accounts for about 30%
> > of the context switch cost. On x86. On other architectures it's often
> > much, much cheaper.
>
> TLB flushes are expensive everywhere, and you know exactly this and if you
Not every processor is dumb enough to have TLB flush on a context switch.
If you have tags on your tlb/caches it's not a problem.
> Again, the history of our UP scheduler thought us that noone has been able
> to makes it suffer with realistic/high not-stupid-benchamrks loads.
Apache under load, DB2, Postgresql, Lotus domino all show bad behaviour.
(Whether apache, db2, and postgresql want fixing differently is a seperate
argument)
Alan
^ permalink raw reply [flat|nested] 65+ messages in thread
* Re: [announce] [patch] ultra-scalable O(1) SMP and UP scheduler
  2002-01-05 23:41       ` Alan Cox
@ 2002-01-05 23:46         ` Davide Libenzi
  0 siblings, 0 replies; 65+ messages in thread
From: Davide Libenzi @ 2002-01-05 23:46 UTC (permalink / raw)
  To: Alan Cox; +Cc: Ingo Molnar, lkml, Linus Torvalds

On Sat, 5 Jan 2002, Alan Cox wrote:

> > > In fact it's the cr3 switch (movl %0, %%cr3) that accounts for about 30%
> > > of the context switch cost. On x86. On other architectures it's often
> > > much, much cheaper.
> >
> > TLB flushes are expensive everywhere, and you know exactly this and if you
>
> Not every processor is dumb enough to have TLB flush on a context switch.
> If you have tags on your tlb/caches it's not a problem.

Yep true, 20% of CPUs are dumb but this 20% of CPUs run 95% of the Linux world.


> > Again, the history of our UP scheduler thought us that noone has been able
> > to makes it suffer with realistic/high not-stupid-benchamrks loads.
>
> Apache under load, DB2, Postgresql, Lotus domino all show bad behaviour.
> (Whether apache, db2, and postgresql want fixing differently is a seperate
>  argument)

Alan, near to my box i've a dual cpu appliance that is running an mta that
uses pthread and that is routing ( under test ) about 600000 messages / hour
Its rq load is about 9-10 and the cs is about 8000-9000.
You know what is the scheduler weight, barely 8-10% with the the 2.4.17
scheduler. It drops to nothing using BMQS w/out any O(1) mirage.


- Davide


^ permalink raw reply	[flat|nested] 65+ messages in thread
* Re: [announce] [patch] ultra-scalable O(1) SMP and UP scheduler
  2002-01-05 23:04     ` Davide Libenzi
  2002-01-05 23:41       ` Alan Cox
@ 2002-01-06  0:47       ` Linus Torvalds
  2002-01-06  2:57         ` Ingo Molnar
  2002-01-06  2:49       ` Ingo Molnar
  2 siblings, 1 reply; 65+ messages in thread
From: Linus Torvalds @ 2002-01-06  0:47 UTC (permalink / raw)
  To: Davide Libenzi; +Cc: Ingo Molnar, lkml, Alan Cox


On Sat, 5 Jan 2002, Davide Libenzi wrote:
>
> No Ingo the fact that you coded the patch this time does not really change
> the workloads, once you've a per-cpu run queue and lock. The thing that
> makes big servers to suffer in the common queue plus the cache coherency
> traffic due the common lock.

What do the per-CPU queue patches look like? I agree with Davide that it
seems much more sensible from a scalability standpoint to allow O(n)  (or
whatever) but with local queues. That should also very naturally give CPU
affinity ;)

The problem with local queues is how to sanely break the CPU affinity
when it needs breaking. Which is not necessarily all that often, but
clearly does need to happen.

It would be nice to have the notion of a cluster scheduler with a clear
"transfer to another CPU" operation, and actively trying to minimize the
number of transfers.

What are those algorithms like? This are must have tons of scientific
papers.

		Linus


^ permalink raw reply	[flat|nested] 65+ messages in thread
* Re: [announce] [patch] ultra-scalable O(1) SMP and UP scheduler
  2002-01-06  0:47       ` Linus Torvalds
@ 2002-01-06  2:57         ` Ingo Molnar
  2002-01-06  1:27           ` Linus Torvalds
  0 siblings, 1 reply; 65+ messages in thread
From: Ingo Molnar @ 2002-01-06  2:57 UTC (permalink / raw)
  To: Linus Torvalds; +Cc: Davide Libenzi, lkml, Alan Cox


On Sat, 5 Jan 2002, Linus Torvalds wrote:

> What do the per-CPU queue patches look like? I agree with Davide that
> it seems much more sensible from a scalability standpoint to allow
> O(n)  (or whatever) but with local queues. That should also very
> naturally give CPU affinity ;)

(if Davide's post gave you the impression that my patch doesnt do per-CPU
queues then i'd like to point out that it does so. Per-CPU runqueues are a
must for good performance on 8-way boxes and bigger. It's just the actual
implementation of the 'per CPU queue' that is O(1).)

> The problem with local queues is how to sanely break the CPU affinity
> when it needs breaking. Which is not necessarily all that often, but
> clearly does need to happen.

yes. The rule i did is this: 'if the runqueue of another CPU is longer by
more than 10% than our own runqueue then we pull over 5% of tasks'.

we also need to break affinity to get basic fairness - otherwise we might
end up running 10 CPU-bound tasks on CPU1 each using 10% of CPU time, and
a single CPU-bound task on CPU2, using up 100% of CPU time.

> It would be nice to have the notion of a cluster scheduler with a
> clear "transfer to another CPU" operation, and actively trying to
> minimize the number of transfers.

i'm doing this in essence in the set_cpus_allowed() function, it transfers
a task from one CPU's queue to another one.

there are two task migration types:

- a CPU 'pulls' tasks. My patch does this whenever a CPU goes idle, and
  does it periodically from the timer tick. This is the load_balance()
  code. It looks at runqueue lengths and tries to pick a task from another
  CPU that wont have a chance to run there in the near future (and would
  thus lose cache footprint anyway). The load balancer is what should be
  made aware of the caching hierarchy, NUMA, hyperthreading and the rest.

- a CPU might 'push' tasks. Right now my patch does this only when a
  process becomes 'illegal' on a CPU, ie. the cpus_allowed bitmask
  excludes the currently running CPU.

the migration itself needs a slightly more complex locking, but it's
relatively straightforward. Otherwise the per-CPU runqueue locks stay on
those CPUs nicely and scalability is very good.

	Ingo


^ permalink raw reply	[flat|nested] 65+ messages in thread
* Re: [announce] [patch] ultra-scalable O(1) SMP and UP scheduler
  2002-01-06  2:57         ` Ingo Molnar
@ 2002-01-06  1:27           ` Linus Torvalds
  2002-01-06  1:45             ` Davide Libenzi
                               ` (2 more replies)
  0 siblings, 3 replies; 65+ messages in thread
From: Linus Torvalds @ 2002-01-06  1:27 UTC (permalink / raw)
  To: Ingo Molnar; +Cc: Davide Libenzi, lkml, Alan Cox


On Sun, 6 Jan 2002, Ingo Molnar wrote:
>
> (if Davide's post gave you the impression that my patch doesnt do per-CPU
> queues then i'd like to point out that it does so. Per-CPU runqueues are a
> must for good performance on 8-way boxes and bigger. It's just the actual
> implementation of the 'per CPU queue' that is O(1).)

Ahh, ok. No worries then.

At that point I don't think O(1) matters all that much, but it certainly
won't hurt. UNLESS it causes bad choices to be made. Which we can only
guess at right now.

Just out of interest, where have the bugs crept up? I think we could just
try out the thing and see what's up, but I know that at least some
versions of bash are buggy and _will_ show problems due to the "run child
first" behaviour. Remember:  we actually tried that for a while in 2.4.x.

[ In 2.5.x it's fine to break broken programs, though, so this isn't that
  much of an issue any more. From the reports I've seen the thing has
  shown more bugs than that, though. I'd happily test a buggy scheduler,
  but I don't want to mix bio problems _and_ scheduler problems, so I'm
  not ready to switch over until either the scheduler patch looks stable,
  or the bio stuff has finalized more. ]

		Linus


^ permalink raw reply	[flat|nested] 65+ messages in thread
* Re: [announce] [patch] ultra-scalable O(1) SMP and UP scheduler
2002-01-06 1:27 ` Linus Torvalds
@ 2002-01-06 1:45 ` Davide Libenzi
2002-01-06 3:55 ` Ingo Molnar
2002-01-06 3:41 ` Ingo Molnar
2002-01-07 8:00 ` Jens Axboe
2 siblings, 1 reply; 65+ messages in thread
From: Davide Libenzi @ 2002-01-06 1:45 UTC (permalink / raw)
To: Linus Torvalds; +Cc: Ingo Molnar, lkml, Alan Cox
On Sat, 5 Jan 2002, Linus Torvalds wrote:
>
> On Sun, 6 Jan 2002, Ingo Molnar wrote:
> >
> > (if Davide's post gave you the impression that my patch doesnt do per-CPU
> > queues then i'd like to point out that it does so. Per-CPU runqueues are a
> > must for good performance on 8-way boxes and bigger. It's just the actual
> > implementation of the 'per CPU queue' that is O(1).)
>
> Ahh, ok. No worries then.
>
> At that point I don't think O(1) matters all that much, but it certainly
> won't hurt. UNLESS it causes bad choices to be made. Which we can only
> guess at right now.
You're the men :)
Ok, this stops all the talks Ingo.
Can you send me a link, there're different things to be fixed IMHO.
The load estimator can easily use the current dyn_prio/time_slice by
simplyfing things a _lot_
I would suggest a lower number of queues, 32 is way more than necessary.
The rt code _must_ be better, it can be easily done by a smartest wakeup.
There's no need to acquire the whole lock set, at least w/out a checkpoint
solution ( look at BMQS ) that prevents multiple failing lookups inside
the RT queue.
- Davide
^ permalink raw reply [flat|nested] 65+ messages in thread
* Re: [announce] [patch] ultra-scalable O(1) SMP and UP scheduler
  2002-01-06  1:45             ` Davide Libenzi
@ 2002-01-06  3:55               ` Ingo Molnar
  2002-01-06  2:16                 ` Davide Libenzi
  0 siblings, 1 reply; 65+ messages in thread
From: Ingo Molnar @ 2002-01-06  3:55 UTC (permalink / raw)
  To: Davide Libenzi; +Cc: Linus Torvalds, lkml, Alan Cox


On Sat, 5 Jan 2002, Davide Libenzi wrote:

> Can you send me a link, there're different things to be fixed IMHO.

my latest stuff is at:

   http://redhat.com/~mingo/O(1)-scheduler/sched-O1-2.5.2-B1.patch

> The load estimator can easily use the current dyn_prio/time_slice by
> simplyfing things a _lot_

i have experimented with a very high number of variants. I estimated sleep
times, i estimated run times, i estimated runqueue times. Note that the
current estimator measures time spent on the *runqueue*, not time spent on
the CPU. This means that in an overload spike we have an automatically
increasing penalization of tasks that want to run. While i'm not too
emotional about eg. the RT bits, this part of the scheduler is pretty
critical to handle high load smoothly.

the integration effect of the estimator was written to be fast, and it's
fast. Also note that in most of the time we do not even call the
estimator:

        if (p->run_timestamp == jiffies)
                goto enqueue;

ie. in high frequency wakeup situations we'll call into the estimator only
once every jiffy.

> I would suggest a lower number of queues, 32 is way more than necessary.

the reason i used more queues is the 'penalizing' effect of the per-task
load-average estimator. We want to have some priority room these CPU-bound
tasks can escape into, without hurting some of the interactive jobs that
might get a few penalties here and there but still dont reach the maximum
where all the CPU hogs live. (this is p->prio == 63 right now.)

also, i wanted to map all the 39 nice values straight into the priority
space, just to be sure. Some people *might* rely on finegrained priorities
still.

there is one additional thing i wanted to do to reduce the effect of the
64 queues: instead of using a straight doubly-linked list a'la list_t, we
can do a head-pointer that cuts the queue size into half, and reduces
cache footprint of the scheduler data structures as well. But i did not
want to add this until all bugs are fixed, this is an invariant
cache-footprint optimization.

> The rt code _must_ be better, it can be easily done by a smartest
> wakeup. There's no need to acquire the whole lock set, at least w/out
> a checkpoint solution ( look at BMQS ) that prevents multiple failing
> lookups inside the RT queue.

regarding SCHED_OTHER, i have intentionally avoided smart wakeups, pushed
the balancing logic more into the load balancer.

load spikes and big statistical fluctuations of runqueue lengths we should
not care much about - they are spikes we cannot flatten anyway, they can
be gone before the task has finished flushing over its data set to the
other CPU.

regarding RT tasks, i did not want to add something that i know is broken,
even if rt_lock() is arguably heavyweight. I've seen the 'IPI in flight
misses the real picture' situation a number of times and if we want to do
RT scheduling seriously and accurately on SMP then we should give a
perfect solution to it. Would you like me to explain the 'IPI in flight'
problem in detail, or do you agree that it's a problem?

	Ingo


^ permalink raw reply	[flat|nested] 65+ messages in thread
* Re: [announce] [patch] ultra-scalable O(1) SMP and UP scheduler
2002-01-06 3:55 ` Ingo Molnar
@ 2002-01-06 2:16 ` Davide Libenzi
0 siblings, 0 replies; 65+ messages in thread
From: Davide Libenzi @ 2002-01-06 2:16 UTC (permalink / raw)
To: Ingo Molnar; +Cc: Linus Torvalds, lkml, Alan Cox
On Sun, 6 Jan 2002, Ingo Molnar wrote:
>
> On Sat, 5 Jan 2002, Davide Libenzi wrote:
>
> > Can you send me a link, there're different things to be fixed IMHO.
>
> my latest stuff is at:
>
> http://redhat.com/~mingo/O(1)-scheduler/sched-O1-2.5.2-B1.patch
>
> > The load estimator can easily use the current dyn_prio/time_slice by
> > simplyfing things a _lot_
>
> i have experimented with a very high number of variants. I estimated sleep
> times, i estimated run times, i estimated runqueue times. Note that the
> current estimator measures time spent on the *runqueue*, not time spent on
> the CPU. This means that in an overload spike we have an automatically
> increasing penalization of tasks that want to run. While i'm not too
> emotional about eg. the RT bits, this part of the scheduler is pretty
> critical to handle high load smoothly.
>
> the integration effect of the estimator was written to be fast, and it's
> fast. Also note that in most of the time we do not even call the
> estimator:
>
> if (p->run_timestamp == jiffies)
> goto enqueue;
>
> ie. in high frequency wakeup situations we'll call into the estimator only
> once every jiffy.
Like the current one ( pre8 )
You've a per-cpu swap array counter ( old recalc loop ) that you increment
each time you swap arrays.
Each task struct has its rcl_last that is updated when you inject the task
on the run queue :
p->dyn_prio += rcl_curr(task_qid) - p->rcl_last;
p->rcl_last = rcl_curr(task_qid);
if (p->dyn_prio > MAX_DYNPRIO) p->dyn_prio = MAX_DYNPRIO;
Something like this, and you'll push the task on the given queue depending
on 'prio' ( _unsigned_ with the code above ).
Each time a task exaust its time slice you decrease prio.
It works great and it's way simpler.
>
> > I would suggest a lower number of queues, 32 is way more than necessary.
>
> the reason i used more queues is the 'penalizing' effect of the per-task
> load-average estimator. We want to have some priority room these CPU-bound
> tasks can escape into, without hurting some of the interactive jobs that
> might get a few penalties here and there but still dont reach the maximum
> where all the CPU hogs live. (this is p->prio == 63 right now.)
>
> also, i wanted to map all the 39 nice values straight into the priority
> space, just to be sure. Some people *might* rely on finegrained priorities
> still.
>
> there is one additional thing i wanted to do to reduce the effect of the
> 64 queues: instead of using a straight doubly-linked list a'la list_t, we
> can do a head-pointer that cuts the queue size into half, and reduces
> cache footprint of the scheduler data structures as well. But i did not
> want to add this until all bugs are fixed, this is an invariant
> cache-footprint optimization.
Ingo, i did a lot of testing by studying the dyn_prio distribution.
You've a lot of tasks ( i/o bound ) moving between the very firsts ( top )
queues.
> > The rt code _must_ be better, it can be easily done by a smartest
> > wakeup. There's no need to acquire the whole lock set, at least w/out
> > a checkpoint solution ( look at BMQS ) that prevents multiple failing
> > lookups inside the RT queue.
>
> regarding SCHED_OTHER, i have intentionally avoided smart wakeups, pushed
> the balancing logic more into the load balancer.
>
> load spikes and big statistical fluctuations of runqueue lengths we should
> not care much about - they are spikes we cannot flatten anyway, they can
> be gone before the task has finished flushing over its data set to the
> other CPU.
>
> regarding RT tasks, i did not want to add something that i know is broken,
> even if rt_lock() is arguably heavyweight. I've seen the 'IPI in flight
> misses the real picture' situation a number of times and if we want to do
> RT scheduling seriously and accurately on SMP then we should give a
> perfect solution to it. Would you like me to explain the 'IPI in flight'
> problem in detail, or do you agree that it's a problem?
What's the 'IPI in flight' a new counter terrorism measure ? :)
I use a chack point inside BMQS.
There's a global variable that is incremented each time an RT task is woke
up.
There's a local task struct checkpoint that is aligned to the global one
when a lookup inside the RT queue results empty :
if (grt_chkp != rtt_chkp(cpu_number_map(this_cpu)) &&
!list_empty(&runqueue_head(RT_QID)))
goto rt_queue_select;
We've to work on the rt code and the balancing code/hooks
- Davide
^ permalink raw reply [flat|nested] 65+ messages in thread
* Re: [announce] [patch] ultra-scalable O(1) SMP and UP scheduler
  2002-01-06  1:27           ` Linus Torvalds
  2002-01-06  1:45             ` Davide Libenzi
@ 2002-01-06  3:41             ` Ingo Molnar
  2002-01-06  2:02               ` Davide Libenzi
  2002-01-06  4:08               ` Ingo Molnar
  2002-01-07  8:00             ` Jens Axboe
  2 siblings, 2 replies; 65+ messages in thread
From: Ingo Molnar @ 2002-01-06  3:41 UTC (permalink / raw)
  To: Linus Torvalds; +Cc: Davide Libenzi, lkml, Alan Cox


On Sat, 5 Jan 2002, Linus Torvalds wrote:

> At that point I don't think O(1) matters all that much, but it
> certainly won't hurt. UNLESS it causes bad choices to be made. Which
> we can only guess at right now.

i have an escape path for the MM-goodness issue: we can make it
O(nr_running_threads) if need to be, by registering MM users into a per-MM
'MM runqueue', and scanning this runqueue for potentially better
candidates if it's non-empty. In the process case this falls back to O(1),
in the threaded case it would be scanning the whole (local) runqueue in
essence.

And George Anzinger has a nice idea to help those platforms which have
slow bitsearch functions, we can keep a floating pointer of the highest
priority queue which can be made NULL if the last task from a priority
level was used up or can be increased if a higher priority task is added,
this pointer will be correct in most of the time, and we can fall back to
the bitsearch if it's NULL.

so while i think that the O(1) design indeed stretches things a bit and
reduces our moving space, it's i think worth a try. Switching an existing
per-CPU queue design for a full-search design shouldnt be too hard. The
load-balancing parts wont be lost whichever path we chose later on, and
that is the most important bit i think.

> Just out of interest, where have the bugs crept up? I think we could
> just try out the thing and see what's up, but I know that at least
> some versions of bash are buggy and _will_ show problems due to the
> "run child first" behaviour. Remember:  we actually tried that for a
> while in 2.4.x.

i've disabled the 'run child first' behavior in the latest patch at:

        http://redhat.com/~mingo/O(1)-scheduler/sched-O1-2.5.2-B1.patch

the crash bug i've been hunting all day, but i cannot reproduce it which
appears to show it's either something really subtle or something really
stupid. But the patch certainly does not have any of the scarier
strace/ptrace related bug scenarios or 'two CPUs run the same task' bugs,
i've put lots of testing into that part. The only crash remaining in -B1
is a clear NULL pointer dereference in wakeup(), which is a direct bug not
some side-effect, i hope to be able to find it soon.

right now there are a number of very helpful people who are experiencing
those crashes and are ready to run bzImages i compile for them (so that
compiler and build environment is out of the picture) - Pawel Kot for
example. (thanks Pawel!)

> [ In 2.5.x it's fine to break broken programs, though, so this isn't that
>   much of an issue any more. From the reports I've seen the thing has
>   shown more bugs than that, though. I'd happily test a buggy scheduler,
>   but I don't want to mix bio problems _and_ scheduler problems, so I'm
>   not ready to switch over until either the scheduler patch looks stable,
>   or the bio stuff has finalized more. ]

i've disabled it to reduce the number of variables - we can still try and
enable it later on once things have proven to be stable.

	Ingo


^ permalink raw reply	[flat|nested] 65+ messages in thread
* Re: [announce] [patch] ultra-scalable O(1) SMP and UP scheduler
2002-01-06 3:41 ` Ingo Molnar
@ 2002-01-06 2:02 ` Davide Libenzi
2002-01-06 2:13 ` Alan Cox
2002-01-06 4:01 ` Ingo Molnar
2002-01-06 4:08 ` Ingo Molnar
1 sibling, 2 replies; 65+ messages in thread
From: Davide Libenzi @ 2002-01-06 2:02 UTC (permalink / raw)
To: Ingo Molnar; +Cc: Linus Torvalds, lkml, Alan Cox
On Sun, 6 Jan 2002, Ingo Molnar wrote:
> And George Anzinger has a nice idea to help those platforms which have
> slow bitsearch functions, we can keep a floating pointer of the highest
> priority queue which can be made NULL if the last task from a priority
> level was used up or can be increased if a higher priority task is added,
> this pointer will be correct in most of the time, and we can fall back to
> the bitsearch if it's NULL.
Ingo, you don't need that many queues, 32 are more than sufficent.
If you look at the distribution you'll see that it matters ( for
interactive feel ) only the very first ( top ) queues, while lower ones
can very easily tollerate a FIFO pickup w/out bad feelings.
- Davide
^ permalink raw reply [flat|nested] 65+ messages in thread
* Re: [announce] [patch] ultra-scalable O(1) SMP and UP scheduler
  2002-01-06  2:02               ` Davide Libenzi
@ 2002-01-06  2:13                 ` Alan Cox
  2002-01-06  2:12                   ` Davide Libenzi
                                     ` (3 more replies)
  2002-01-06  4:01                 ` Ingo Molnar
  1 sibling, 4 replies; 65+ messages in thread
From: Alan Cox @ 2002-01-06  2:13 UTC (permalink / raw)
  To: Davide Libenzi; +Cc: Ingo Molnar, Linus Torvalds, lkml, Alan Cox

> Ingo, you don't need that many queues, 32 are more than sufficent.
> If you look at the distribution you'll see that it matters ( for
> interactive feel ) only the very first ( top ) queues, while lower ones
> can very easily tollerate a FIFO pickup w/out bad feelings.

64 queues costs a tiny amount more than 32 queues. If you can get it down
to eight or nine queues with no actual cost (espcially for non realtime queues)
then it represents a huge win since an 8bit ffz can be done by lookup table
and that is fast on all processors

^ permalink raw reply	[flat|nested] 65+ messages in thread
* Re: [announce] [patch] ultra-scalable O(1) SMP and UP scheduler
2002-01-06 2:13 ` Alan Cox
@ 2002-01-06 2:12 ` Davide Libenzi
2002-01-06 2:20 ` Alan Cox
2002-01-06 3:30 ` 2.4.17 kernel without modules...was " Vikram
` (2 subsequent siblings)
3 siblings, 1 reply; 65+ messages in thread
From: Davide Libenzi @ 2002-01-06 2:12 UTC (permalink / raw)
To: Alan Cox; +Cc: Ingo Molnar, Linus Torvalds, lkml
On Sun, 6 Jan 2002, Alan Cox wrote:
> > Ingo, you don't need that many queues, 32 are more than sufficent.
> > If you look at the distribution you'll see that it matters ( for
> > interactive feel ) only the very first ( top ) queues, while lower ones
> > can very easily tollerate a FIFO pickup w/out bad feelings.
>
> 64 queues costs a tiny amount more than 32 queues. If you can get it down
> to eight or nine queues with no actual cost (espcially for non realtime queues)
> then it represents a huge win since an 8bit ffz can be done by lookup table
> and that is fast on all processors
It's here that i want to go, but i'd liketo do it gradually :)
unsigned char first_bit[255];
- Davide
^ permalink raw reply [flat|nested] 65+ messages in thread* Re: [announce] [patch] ultra-scalable O(1) SMP and UP scheduler
2002-01-06 2:12 ` Davide Libenzi
@ 2002-01-06 2:20 ` Alan Cox
2002-01-06 2:17 ` Davide Libenzi
0 siblings, 1 reply; 65+ messages in thread
From: Alan Cox @ 2002-01-06 2:20 UTC (permalink / raw)
To: Davide Libenzi; +Cc: Alan Cox, Ingo Molnar, Linus Torvalds, lkml
> > then it represents a huge win since an 8bit ffz can be done by lookup table
> > and that is fast on all processors
>
> It's here that i want to go, but i'd liketo do it gradually :)
> unsigned char first_bit[255];
Make it [256] and you can do 9 queues since the idle task will always
be queued...
^ permalink raw reply [flat|nested] 65+ messages in thread
* Re: [announce] [patch] ultra-scalable O(1) SMP and UP scheduler
  2002-01-06  2:20                     ` Alan Cox
@ 2002-01-06  2:17                       ` Davide Libenzi
  0 siblings, 0 replies; 65+ messages in thread
From: Davide Libenzi @ 2002-01-06  2:17 UTC (permalink / raw)
  To: Alan Cox; +Cc: Ingo Molnar, Linus Torvalds, lkml

On Sun, 6 Jan 2002, Alan Cox wrote:

> > > then it represents a huge win since an 8bit ffz can be done by lookup table
> > > and that is fast on all processors
> >
> > It's here that i want to go, but i'd liketo do it gradually :)
> > unsigned char first_bit[255];
>
> Make it [256] and you can do 9 queues since the idle task will always
> be queued...

Mistyping error :)


- Davide


^ permalink raw reply	[flat|nested] 65+ messages in thread
* 2.4.17 kernel without modules...was Re:O(1) SMP and UP scheduler
  2002-01-06  2:13                 ` Alan Cox
  2002-01-06  2:12                   ` Davide Libenzi
@ 2002-01-06  3:30                   ` Vikram
  2002-01-06  4:07                   ` [announce] [patch] ultra-scalable O(1) " Ingo Molnar
  2002-01-07  3:08                   ` Richard Henderson
  3 siblings, 0 replies; 65+ messages in thread
From: Vikram @ 2002-01-06  3:30 UTC (permalink / raw)
  To: Ingo Molnar; +Cc: lkml


hi ingo,

i am running 2.4.17 on an AMD duron 256MB RAM here. i tried the 2.4.17-B4
patch on a freshly built UP kernel . it applied successfully.

as you had mentioned earlier i built it _without_ modules. it
boots up fine and all that....goes to xdm ---> hard lockup after that.

	Vikram


On Sun, 6 Jan 2002, Alan Cox wrote:

> > Ingo, you don't need that many queues, 32 are more than sufficent.
> > If you look at the distribution you'll see that it matters ( for
> > interactive feel ) only the very first ( top ) queues, while lower ones
> > can very easily tollerate a FIFO pickup w/out bad feelings.
>
> 64 queues costs a tiny amount more than 32 queues. If you can get it down
> to eight or nine queues with no actual cost (espcially for non realtime queues)
> then it represents a huge win since an 8bit ffz can be done by lookup table
> and that is fast on all processors
> -
> To unsubscribe from this list: send the line "unsubscribe linux-kernel" in
> the body of a message to majordomo@vger.kernel.org
> More majordomo info at  http://vger.kernel.org/majordomo-info.html
> Please read the FAQ at  http://www.tux.org/lkml/
>


^ permalink raw reply	[flat|nested] 65+ messages in thread
* Re: [announce] [patch] ultra-scalable O(1) SMP and UP scheduler
  2002-01-06  2:13                 ` Alan Cox
  2002-01-06  2:12                   ` Davide Libenzi
  2002-01-06  3:30                   ` 2.4.17 kernel without modules...was " Vikram
@ 2002-01-06  4:07                   ` Ingo Molnar
  2002-01-06  2:23                     ` Davide Libenzi
  2002-01-06  2:30                     ` Alan Cox
  2002-01-07  3:08                   ` Richard Henderson
  3 siblings, 2 replies; 65+ messages in thread
From: Ingo Molnar @ 2002-01-06  4:07 UTC (permalink / raw)
  To: Alan Cox; +Cc: Davide Libenzi, Linus Torvalds, lkml


On Sun, 6 Jan 2002, Alan Cox wrote:

> 64 queues costs a tiny amount more than 32 queues. If you can get it
> down to eight or nine queues with no actual cost (espcially for non
> realtime queues) then it represents a huge win since an 8bit ffz can
> be done by lookup table and that is fast on all processors

i'm afraid that while 32 might work, 8 will definitely not be enough. In
the interactivity-detection scheme i added it's important for interactive
tasks to have some room (in terms of priority levels) to go up without
hitting the levels of the true CPU abusers.

we can do 32-bit ffz by doing 4x 8-bit ffz's though:

	if (likely(byte[0]))
		return ffz8[byte[0]];
	else if (byte[1])
		return ffz8[byte[1]];
	else if (byte[2]
		return ffz8[byte[2]];
	else if (byte[3]
		return ffz8[byte[3]];
	else
		return -1;

and while this is still 4 branches, it's better than a loop of 32. But i
also think that George Anzinger's idea works well too to reduce the cost
of bitsearching. Or those platforms that decide to do so could search the
arrray directly as well - if it's 32 queues then it's a cache footprint of
4 cachelines, which can be searched directly without any problem.

	Ingo


^ permalink raw reply	[flat|nested] 65+ messages in thread
* Re: [announce] [patch] ultra-scalable O(1) SMP and UP scheduler
  2002-01-06  4:07                   ` [announce] [patch] ultra-scalable O(1) " Ingo Molnar
@ 2002-01-06  2:23                     ` Davide Libenzi
  2002-01-06  2:30                     ` Alan Cox
  1 sibling, 0 replies; 65+ messages in thread
From: Davide Libenzi @ 2002-01-06  2:23 UTC (permalink / raw)
  To: Ingo Molnar; +Cc: Alan Cox, Linus Torvalds, lkml

On Sun, 6 Jan 2002, Ingo Molnar wrote:

>
> On Sun, 6 Jan 2002, Alan Cox wrote:
>
> > 64 queues costs a tiny amount more than 32 queues. If you can get it
> > down to eight or nine queues with no actual cost (espcially for non
> > realtime queues) then it represents a huge win since an 8bit ffz can
> > be done by lookup table and that is fast on all processors
>
> i'm afraid that while 32 might work, 8 will definitely not be enough. In
> the interactivity-detection scheme i added it's important for interactive
> tasks to have some room (in terms of priority levels) to go up without
> hitting the levels of the true CPU abusers.
>
> we can do 32-bit ffz by doing 4x 8-bit ffz's though:
>
> 	if (likely(byte[0]))
> 		return ffz8[byte[0]];
> 	else if (byte[1])
> 		return ffz8[byte[1]];
> 	else if (byte[2]
> 		return ffz8[byte[2]];
> 	else if (byte[3]
> 		return ffz8[byte[3]];
> 	else
> 		return -1;
>
> and while this is still 4 branches, it's better than a loop of 32. But i
> also think that George Anzinger's idea works well too to reduce the cost
> of bitsearching. Or those platforms that decide to do so could search the
> arrray directly as well - if it's 32 queues then it's a cache footprint of
> 4 cachelines, which can be searched directly without any problem.

dyn_prio -> [0..15]

each time a task exaust its ts you decrease dyn_prio.

queue = dyn_prio >> 1

You get 16 consecutive CPU hog steps before falling in the hell of CPU
bound tasks


- Davide


^ permalink raw reply	[flat|nested] 65+ messages in thread
* Re: [announce] [patch] ultra-scalable O(1) SMP and UP scheduler
  2002-01-06  4:07                   ` [announce] [patch] ultra-scalable O(1) " Ingo Molnar
  2002-01-06  2:23                     ` Davide Libenzi
@ 2002-01-06  2:30                     ` Alan Cox
  2002-01-06  4:19                       ` Ingo Molnar
  1 sibling, 1 reply; 65+ messages in thread
From: Alan Cox @ 2002-01-06  2:30 UTC (permalink / raw)
  To: mingo; +Cc: Alan Cox, Davide Libenzi, Linus Torvalds, lkml

> we can do 32-bit ffz by doing 4x 8-bit ffz's though:

There are better algorithms than the branching one already. You can
do it a 32bit one with a multiply shift and 6 bit lookup if your multiply
is ok, or for non superscalar processors using shift and adds.

64bit is 32bit ffz(x.low|x.high) and a single bit test

I can dig out the 32bit one if need be (its from a NetBSD mailing list)

^ permalink raw reply	[flat|nested] 65+ messages in thread
* Re: [announce] [patch] ultra-scalable O(1) SMP and UP scheduler
  2002-01-06  2:30                     ` Alan Cox
@ 2002-01-06  4:19                       ` Ingo Molnar
  0 siblings, 0 replies; 65+ messages in thread
From: Ingo Molnar @ 2002-01-06  4:19 UTC (permalink / raw)
  To: Alan Cox; +Cc: Davide Libenzi, Linus Torvalds, lkml


On Sun, 6 Jan 2002, Alan Cox wrote:

> There are better algorithms than the branching one already. You can do
> it a 32bit one with a multiply shift and 6 bit lookup if your multiply
> is ok, or for non superscalar processors using shift and adds.
>
> 64bit is 32bit ffz(x.low|x.high) and a single bit test

ok - i wasnt thinking straight. as few branches as possible should be the
way to go, no BTB will help such functions so branches must be reduced.

	Ingo


^ permalink raw reply	[flat|nested] 65+ messages in thread
* Re: [announce] [patch] ultra-scalable O(1) SMP and UP scheduler
  2002-01-06  2:13                 ` Alan Cox
                                     ` (2 preceding siblings ...)
  2002-01-06  4:07                   ` [announce] [patch] ultra-scalable O(1) " Ingo Molnar
@ 2002-01-07  3:08                   ` Richard Henderson
  2002-01-07  3:16                     ` Linus Torvalds
  3 siblings, 1 reply; 65+ messages in thread
From: Richard Henderson @ 2002-01-07  3:08 UTC (permalink / raw)
  To: Alan Cox; +Cc: Davide Libenzi, Ingo Molnar, Linus Torvalds, lkml

On Sun, Jan 06, 2002 at 02:13:32AM +0000, Alan Cox wrote:
> ... since an 8bit ffz can be done by lookup table
> and that is fast on all processors

Please still provide the arch hook -- single cycle ffs type
instructions are still faster than any memory access.


r~

^ permalink raw reply	[flat|nested] 65+ messages in thread
* Re: [announce] [patch] ultra-scalable O(1) SMP and UP scheduler
2002-01-07 3:08 ` Richard Henderson
@ 2002-01-07 3:16 ` Linus Torvalds
2002-01-07 3:31 ` Davide Libenzi
0 siblings, 1 reply; 65+ messages in thread
From: Linus Torvalds @ 2002-01-07 3:16 UTC (permalink / raw)
To: Richard Henderson; +Cc: Alan Cox, Davide Libenzi, Ingo Molnar, lkml
On Sun, 6 Jan 2002, Richard Henderson wrote:
> On Sun, Jan 06, 2002 at 02:13:32AM +0000, Alan Cox wrote:
> > ... since an 8bit ffz can be done by lookup table
> > and that is fast on all processors
>
> Please still provide the arch hook -- single cycle ffs type
> instructions are still faster than any memory access.
This is probably true even on x86, except in benchmarks (the x86 ffs
instruction definitely doesn't historically count as "fast", and a table
lookup will probably win in a benchmark where the table is hot in the
cache, but you don't have to miss very often to be ok with a few CPU
cycles..)
(bsfl used to be very slow. That's not as true any more)
Linus
^ permalink raw reply [flat|nested] 65+ messages in thread
* Re: [announce] [patch] ultra-scalable O(1) SMP and UP scheduler
  2002-01-07  3:16                     ` Linus Torvalds
@ 2002-01-07  3:31                       ` Davide Libenzi
  2002-01-07  3:34                         ` Linus Torvalds
  0 siblings, 1 reply; 65+ messages in thread
From: Davide Libenzi @ 2002-01-07  3:31 UTC (permalink / raw)
  To: Linus Torvalds; +Cc: Richard Henderson, Alan Cox, Ingo Molnar, lkml

On Sun, 6 Jan 2002, Linus Torvalds wrote:

>
> On Sun, 6 Jan 2002, Richard Henderson wrote:
> > On Sun, Jan 06, 2002 at 02:13:32AM +0000, Alan Cox wrote:
> > > ... since an 8bit ffz can be done by lookup table
> > > and that is fast on all processors
> >
> > Please still provide the arch hook -- single cycle ffs type
> > instructions are still faster than any memory access.
>
> This is probably true even on x86, except in benchmarks (the x86 ffs
> instruction definitely doesn't historically count as "fast", and a table
> lookup will probably win in a benchmark where the table is hot in the
> cache, but you don't have to miss very often to be ok with a few CPU
> cycles..)
>
> (bsfl used to be very slow. That's not as true any more)

32 bit words lookup can be easily done in few clock cycles in most cpus
by using tuned assembly code.


- Davide


^ permalink raw reply	[flat|nested] 65+ messages in thread
* Re: [announce] [patch] ultra-scalable O(1) SMP and UP scheduler
  2002-01-07  3:31                       ` Davide Libenzi
@ 2002-01-07  3:34                         ` Linus Torvalds
  2002-01-07  3:49                           ` Davide Libenzi
  0 siblings, 1 reply; 65+ messages in thread
From: Linus Torvalds @ 2002-01-07  3:34 UTC (permalink / raw)
  To: Davide Libenzi; +Cc: Richard Henderson, Alan Cox, Ingo Molnar, lkml


On Sun, 6 Jan 2002, Davide Libenzi wrote:
>
> 32 bit words lookup can be easily done in few clock cycles in most cpus
> by using tuned assembly code.

I tried to time "bsfl", it showed up as one cycle more than "nothing" on
my PII.

It used to be something like 7+n cycles on a i386, if I remember
correctly. It's just not an issue any more - trying to use clever code to
avoid it is just silly.

		Linus


^ permalink raw reply	[flat|nested] 65+ messages in thread
* Re: [announce] [patch] ultra-scalable O(1) SMP and UP scheduler
  2002-01-07  3:34                         ` Linus Torvalds
@ 2002-01-07  3:49                           ` Davide Libenzi
  0 siblings, 0 replies; 65+ messages in thread
From: Davide Libenzi @ 2002-01-07  3:49 UTC (permalink / raw)
  To: Linus Torvalds; +Cc: Richard Henderson, Alan Cox, Ingo Molnar, lkml

On Sun, 6 Jan 2002, Linus Torvalds wrote:

>
> On Sun, 6 Jan 2002, Davide Libenzi wrote:
> >
> > 32 bit words lookup can be easily done in few clock cycles in most cpus
> > by using tuned assembly code.
>
> I tried to time "bsfl", it showed up as one cycle more than "nothing" on
> my PII.
>
> It used to be something like 7+n cycles on a i386, if I remember
> correctly. It's just not an issue any more - trying to use clever code to
> avoid it is just silly.

I think the issue was about architectures that does not have bsfl like ops


- Davide


^ permalink raw reply	[flat|nested] 65+ messages in thread
* Re: [announce] [patch] ultra-scalable O(1) SMP and UP scheduler
  2002-01-06  2:02               ` Davide Libenzi
  2002-01-06  2:13                 ` Alan Cox
@ 2002-01-06  4:01                 ` Ingo Molnar
  1 sibling, 0 replies; 65+ messages in thread
From: Ingo Molnar @ 2002-01-06  4:01 UTC (permalink / raw)
  To: Davide Libenzi; +Cc: Linus Torvalds, lkml, Alan Cox


On Sat, 5 Jan 2002, Davide Libenzi wrote:

> Ingo, you don't need that many queues, 32 are more than sufficent. If
> you look at the distribution you'll see that it matters ( for
> interactive feel ) only the very first ( top ) queues, while lower
> ones can very easily tollerate a FIFO pickup w/out bad feelings.

I have no problem with using 32 queues as long as we keep the code
flexible enough to increase the queue length if needed. I think we should
make it flexible and not restrict ourselves to something like word size.
(with this i'm not suggesting that you meant this, i'm just trying to make
sure.) I saw really good (behavioral, latency, not performance) effects of
the longer queue under high load, but this must be weighed against the
cache footprint of the queues.

	Ingo


^ permalink raw reply	[flat|nested] 65+ messages in thread
* Re: [announce] [patch] ultra-scalable O(1) SMP and UP scheduler
  2002-01-06  3:41             ` Ingo Molnar
  2002-01-06  2:02               ` Davide Libenzi
@ 2002-01-06  4:08               ` Ingo Molnar
  2002-01-06  4:16                 ` Ingo Molnar
  1 sibling, 1 reply; 65+ messages in thread
From: Ingo Molnar @ 2002-01-06  4:08 UTC (permalink / raw)
  To: Linus Torvalds; +Cc: Davide Libenzi, lkml, Alan Cox


doh, the -B1 patch was short by 10k, -B2 is OK:

   http://redhat.com/~mingo/O(1)-scheduler/sched-O1-2.5.2-B2.patch

	Ingo


^ permalink raw reply	[flat|nested] 65+ messages in thread
* Re: [announce] [patch] ultra-scalable O(1) SMP and UP scheduler
  2002-01-06  1:27           ` Linus Torvalds
  2002-01-06  1:45             ` Davide Libenzi
  2002-01-06  3:41             ` Ingo Molnar
@ 2002-01-07  8:00             ` Jens Axboe
  2 siblings, 0 replies; 65+ messages in thread
From: Jens Axboe @ 2002-01-07  8:00 UTC (permalink / raw)
  To: Linus Torvalds; +Cc: Ingo Molnar, Davide Libenzi, lkml, Alan Cox

On Sat, Jan 05 2002, Linus Torvalds wrote:
>   shown more bugs than that, though. I'd happily test a buggy scheduler,
>   but I don't want to mix bio problems _and_ scheduler problems, so I'm

Too late :-)

--
Jens Axboe


^ permalink raw reply	[flat|nested] 65+ messages in thread
* Re: [announce] [patch] ultra-scalable O(1) SMP and UP scheduler
  2002-01-05 23:04     ` Davide Libenzi
  2002-01-05 23:41       ` Alan Cox
  2002-01-06  0:47       ` Linus Torvalds
@ 2002-01-06  2:49       ` Ingo Molnar
  2 siblings, 0 replies; 65+ messages in thread
From: Ingo Molnar @ 2002-01-06  2:49 UTC (permalink / raw)
  To: Davide Libenzi; +Cc: lkml, Linus Torvalds, Alan Cox


On Sat, 5 Jan 2002, Davide Libenzi wrote:

> In even _high_realistic_ workloads on these servers the scheduler
> impact is never more than 5-15% and by simply splitting the queue/lock
> you get a 30 up to 60 time fold ( see picture ), that makes the
> scheduler impact to go down to 0.2-0.3%. Why do you need to
> overoptimize for a 0.2% ?

the chat simulator simulates Lotus workload pretty well. There are lots of
other workloads that create similar situations. Davide, i honestly think
that you are sticking your head into the sand if you say that many
processes on the runqueue do not happen or do not matter. I used to say
exactly what you say now, and i've seen enough bad scheduling behavior to
have started this O(1) project.

> > In fact it's the cr3 switch (movl %0, %%cr3) that accounts for about 30%
> > of the context switch cost. On x86. On other architectures it's often
> > much, much cheaper.
>
> TLB flushes are expensive everywhere, [...]

you dont know what you are talking about. Most modern CPUs dont need a TLB
flush on context switch, they have tagged caches. And yes, some day we
might even see x86-compatible CPUs that have sane internals.

> and you know exactly this and if you used a cycle counter to analyze
> the scheduler instead of silly benchmarks you would probably know more
> about what inside a context switch does matter.

How do you explain this then:

2.5.2-pre9 vanilla:

 [mingo@a l]$ while true; do ./lat_ctx -s 0 2 2>&1 | grep ^2; done
 2 1.64
 2 1.62

2.5.2-pre9 -B1 O(1) scheduler patch:

 [mingo@a l]$ while true; do ./lat_ctx -s 0 2 2>&1 | grep ^2; done
 2 1.57
 2 1.55

ie. UP, 2-task context switch times became slightly faster. By your
argument it should be significantly slower or worse.

with 10 CPU-intensive tasks running the background, 2.5.2-pre9 + B1 O(1)
patch:

 [root@a l]# nice -n -100 ./lat_ctx -s 0 2
 2 1.57

(ie. the very same context-switch performance - not unexpected from an
O(1) scheduler). While the vanilla scheduler:

 [root@a l]# nice -n -100 ./lat_ctx -s 0 2
 2 2.20

ie. 33% slower already. With 50 background tasks, it's:

 [root@a l]# nice -n -100 ./lat_ctx -s 0 2
 2 17.49

ie. it's more than 10 times slower already. And the O(1) still goes steady
1.57 microseconds.

this is called an exponential breakdown in system characteristics.

If you say that i do not care about and count every cycle spent in the
scheduler then you do not know me.

> Ingo your RT code sucks [.. 10 more lines of patch-bashing snipped ..]

please answer the technical issues i raised. I've taken a quick peek at
your patch, and you do not appear to solve the IPI asynchronity problem i
raised. Ie. your scheduler might end up running the wrong RT tasks on the
wrong CPUs.

> I'm sorry but you set p->run_timestamp to jiffies when the task is run
> and you make curr_sample = j / HZ when it stops running. If you divide
> by HZ you'll obtain seconds. [...]
[...]
> Now, if you divide by HZ, what do you obtain ?
[...]
> delta will be ~97% always zero, and the remaining 3% one ( because of
> HZ scale crossing ). Now this is not my code but do you understand
> your code ? Do you understand why it's broken ?

i obtain a 'history slot index' to the history array via dividing by HZ.
The real statistics is jiffies-accurate, of course. The 'load history' of
the process is stored in a 4-entry (can be redefined) history array, which
is cycled around so that we have a history. The code in essence does an
integral of load over time, and for that one has to use some sort of
memory buffer.

I'd again like to ask you to read and understand the code, not bash it
mindlessly.

> > (in my current codebase i've changed the load-balancer to be called with a
> > maximum frequency of 100 - eg. if HZ is set to 1000 then we still call the
> > load balancer only 100 times a second.)
>
> Wow, only 100 times, it's pretty good. You're travelling between the
> CPU data only 100 times per second probably trashing the running
> process cache image, but overall it's pretty good code.

Davide, please. If you take a look at the code then you'll notice that the
prime target for load-balancing are expired processes, ie. processes which
wont run on that CPU for some time. And if you had bothered to try my
patch then you'd have seen that CPU-bound tasks do not get misbalanced.
The other reason to call the load balancer rather frequently is to
distribute CPU-bound tasks between CPUs fairly.

but this shouldnt matter in your world too much, since long runqueues do
not exist or matter, right? ;-)

> And please do not say me to measure something like this. [...]

i for one will keep measuring things, the proof of the pudding is eating.

> Adding a multi level priority is no more than 10 minutes of code
> inside BMQS but i thought it was useless and i did not code it. Even a
> dual queue + FIFO pickups :
>
> http://www.xmailserver.org/linux-patches/mss-2.html#dualqueue

what i do is something pretty different. The dual array i use is to gather
tasks that have expired timeslices. The goal is to distribute timeslices
fairly, ie. a task that has an expired timeslice cannot run until all
tasks expire their timeslices in the active array. All tasks of all
priorities.

just for the record, i had this idea years ago (in '96 or '97) but never
implemented it past some very embryonic state (which i sent to DaveM and
Linus [perhaps Alan too] as a matter of fact - back then i called it the
'matrix scheduler'), until i faced the chat simulator workload recently.
That workload the current scheduler (or simple multiqueue schedulers)
mishandles badly. Please give me the URL that points to a patch that does
the same thing to solve the fair timeslice distribution problem.

> [...] You know what makes me angry ? It's not that you can sell this
> stuff to guys that knows how things works in a kernel, i'm getting
> angry because i think about guys actually reading your words and that
> really think that using an O(1) scheduler can change their
> life/system-problems. And they're going to spend their time trying
> this stuff. [...]

Will the O(1) patch matter for systems that have a 0-length runqueue most
of the time? Not the least. [the SMP affinity improvements might help
though, but similar things are done in other patches as well.] But this
scheduler was the first one i ever saw producing a sane results for the
chat simulator, and while my patch might not be merged into the mainline,
it will always be an option for those 'hopeless' workloads, or university
servers where hundreds of CPU-bound tasks are executing on the same poor
overloaded box.

	Ingo


^ permalink raw reply	[flat|nested] 65+ messages in thread
* Re: [announce] [patch] ultra-scalable O(1) SMP and UP scheduler
  2002-01-04  2:19 [announce] [patch] ultra-scalable O(1) SMP and UP scheduler Ingo Molnar
                   ` (5 preceding siblings ...)
  2002-01-05  4:33 ` Davide Libenzi
@ 2002-01-07  2:58 ` Rusty Russell
  6 siblings, 0 replies; 65+ messages in thread
From: Rusty Russell @ 2002-01-07  2:58 UTC (permalink / raw)
  To: mingo; +Cc: linux-kernel

In message <Pine.LNX.4.33.0201040050440.1363-100000@localhost.localdomain> you
write:
>
> now that new-year's parties are over things are getting boring again. For
> those who want to see and perhaps even try something more complex, i'm
> announcing this patch that is a pretty radical rewrite of the Linux
> scheduler for 2.5.2-pre6:

Hi Ingo...

	Reading through 2.5.2-C1, couple of comments/questions:

sched.c line 402:
	/*
	 * Current runqueue is empty, try to find work on
	 * other runqueues.
	 *
	 * We call this with the current runqueue locked,
	 * irqs disabled.
	 */
	static void load_balance(runqueue_t *this_rq)

This first comment doesn't seem to be true: it also seems to be called
from idle_tick and expire task.  Perhaps it'd be nicer too, to split
load_balance into "if (is_unbalanced(cpu())) pull_task(cpu())".  (I
like "pull_" and "push_" nomenclature for the scheduler).

sched.c load_balance() line 435:

		if ((load > max_load) && (load < prev_max_load) &&
						(rq_tmp != this_rq)) {

Why are you ignoring a CPU with more than the previous maximum load
(prev_max_load is incremented earlier)?

sched.c expire_task line 552:

	if (p->array != rq->active) {
		p->need_resched = 1;
		return;
	}

I'm not clear how this can happen??

Finally, I gather you want to change smp_processor_id() to cpu()?
That's fine (smp_num_cpus => num_cpus() too please), but it'd be nice
to have that as a separate patch, rather than getting stuck with BOTH
cpu() and smp_processor_id().

Patch below (untested) corrects SMP_CACHE_BYTES alignment, minor
comment, and rebalance tick for HZ < 100 (ie. User Mode Linux).

Rusty.
PS. Awesome work.
--
  Anyone who quotes me in their sig is an idiot. -- Rusty Russell.

diff -urN -I \$.*\$ --exclude TAGS -X /home/rusty/devel/kernel/kernel-patches/current-dontdiff --minimal working-2.5.2-pre9-mingosched/kernel/sched.c working-2.5.2-pre9-mingoschedfix/kernel/sched.c
--- working-2.5.2-pre9-mingosched/kernel/sched.c	Mon Jan  7 12:39:10 2002
+++ working-2.5.2-pre9-mingoschedfix/kernel/sched.c	Mon Jan  7 13:51:39 2002
@@ -43,14 +43,14 @@
  * if there is a RT task active in an SMP system but there is no
  * RT scheduling activity otherwise.
  */
-static struct runqueue {
+struct runqueue {
 	int cpu;
 	spinlock_t lock;
 	unsigned long nr_running, nr_switches, last_rt_event;
 	task_t *curr, *idle;
 	prio_array_t *active, *expired, arrays[2];
-	char __pad [SMP_CACHE_BYTES];
-} runqueues [NR_CPUS] __cacheline_aligned;
+} ____cacheline_aligned;
+static struct runqueue runqueues[NR_CPUS] __cacheline_aligned;

 #define this_rq()		(runqueues + cpu())
 #define task_rq(p)		(runqueues + (p)->cpu)
@@ -102,7 +102,7 @@
  * This is the per-process load estimator. Processes that generate
  * more load than the system can handle get a priority penalty.
  *
- * The estimator uses a 4-entry load-history ringbuffer which is
+ * The estimator uses a SLEEP_HIST_SIZE-entry load-history ringbuffer which is
  * updated whenever a task is moved to/from the runqueue. The load
  * estimate is also updated from the timer tick to get an accurate
  * estimation of currently executing tasks as well.
@@ -511,7 +511,7 @@
 	spin_unlock(&busiest->lock);
 }

-#define REBALANCE_TICK (HZ/100)
+#define REBALANCE_TICK ((HZ/100) ?: 1)

 void idle_tick(void)
 {

^ permalink raw reply	[flat|nested] 65+ messages in thread
* Re: [announce] [patch] ultra-scalable O(1) SMP and UP scheduler
@ 2002-01-04  3:56 Ed Tomlinson
  0 siblings, 0 replies; 65+ messages in thread
From: Ed Tomlinson @ 2002-01-04  3:56 UTC (permalink / raw)
  To: linux-kernel

Building against 2.4.17 (with rmap-10c applied) I get:

loop.c: In function `loop_thread':
loop.c:574: structure has no member named `nice'
make[2]: *** [loop.o] Error 1
make[2]: Leaving directory `/usr/src/linux/drivers/block'
make[1]: *** [_modsubdir_block] Error 2
make[1]: Leaving directory `/usr/src/linux/drivers'
make: *** [_mod_drivers] Error 2

and

md.c: in function `md_thread':
md.c:2934: structure has no member named `nice'
md.c: In function `md_do_sync_Rdc586d8a':
md.c:3387: structure has no member named `nice'
md.c:3466: structure has no member named `nice'
md.c:3475: structure has no member named `nice'
make[2]: *** [md.o] Error 1
make[2]: Leaving directory `/usr/src/linux/drivers/md'
make[1]: *** [_modsubdir_md] Error 2
make[1]: Leaving directory `/usr/src/linux/drivers'
make: *** [_mod_drivers] Error 2

Changing nice to __nice lets the compile work.  Is this correct?

When installing modules I get:

if [ -r System.map ]; then /sbin/depmod -ae -F System.map  2.4.17rmap10c+O1A0; fi
depmod: *** Unresolved symbols in /lib/modules/2.4.17rmap10c+O1A0/kernel/fs/jbd/jbd.o
depmod:         sys_sched_yield
depmod: *** Unresolved symbols in /lib/modules/2.4.17rmap10c+O1A0/kernel/fs/nfs/nfs.o
depmod:         sys_sched_yield
depmod: *** Unresolved symbols in /lib/modules/2.4.17rmap10c+O1A0/kernel/net/sunrpc/sunrpc.o
depmod:         sys_sched_yield

What needs to be done to fix these symbols?

I used the following correction to fix the rejects in A0 caused
by rmap...

TIA,

Ed Tomlinson

--- x/include/linux/sched.h.orig	Thu Jan  3 21:23:48 2002
+++ x/include/linux/sched.h	Thu Jan  3 21:32:39 2002
@@ -295,34 +295,28 @@

 	int lock_depth;		/* Lock depth */

-/*
- * offset 32 begins here on 32-bit platforms. We keep
- * all fields in a single cacheline that are needed for
- * the goodness() loop in schedule().
- */
-	long counter;
-	long nice;
-	unsigned long policy;
-	struct mm_struct *mm;
-	int processor;
-	/*
-	 * cpus_runnable is ~0 if the process is not running on any
-	 * CPU. It's (1 << cpu) if it's running on a CPU. This mask
-	 * is updated under the runqueue lock.
-	 *
-	 * To determine whether a process might run on a CPU, this
-	 * mask is AND-ed with cpus_allowed.
-	 */
-	unsigned long cpus_runnable, cpus_allowed;
 	/*
-	 * (only the 'next' pointer fits into the cacheline, but
-	 * that's just fine.)
+	 * offset 32 begins here on 32-bit platforms.
 	 */
-	struct list_head run_list;
-	unsigned long sleep_time;
+	unsigned int cpu;
+	int prio;
+	long __nice;
+	list_t run_list;
+	prio_array_t *array;
+
+	unsigned int time_slice;
+	unsigned long sleep_timestamp, run_timestamp;
+
+	#define SLEEP_HIST_SIZE 4
+	int sleep_hist[SLEEP_HIST_SIZE];
+	int sleep_idx;
+
+	unsigned long policy;
+	unsigned long cpus_allowed;

 	struct task_struct *next_task, *prev_task;
-	struct mm_struct *active_mm;
+
+	struct mm_struct *mm, *active_mm;

 /* task state */
 	struct linux_binfmt *binfmt;
--- x/mm/page_alloc.c.orig	Thu Jan  3 21:20:57 2002
+++ x/mm/page_alloc.c	Thu Jan  3 21:21:57 2002
@@ -465,9 +465,7 @@
 		 * NFS: we must yield the CPU (to rpciod) to avoid deadlock.
 		 */
 		if (gfp_mask & __GFP_WAIT) {
-			__set_current_state(TASK_RUNNING);
-			current->policy |= SCHED_YIELD;
-			schedule();
+			yield();
 			if (!order || free_high(ALL_ZONES) >= 0) {
 				int progress = try_to_free_pages(gfp_mask);
 				if (progress || (gfp_mask & __GFP_FS))

^ permalink raw reply	[flat|nested] 65+ messages in thread
* Re: [announce] [patch] ultra-scalable O(1) SMP and UP scheduler
@ 2002-01-04 7:42 Dieter Nützel
2002-01-04 8:02 ` David Lang
0 siblings, 1 reply; 65+ messages in thread
From: Dieter Nützel @ 2002-01-04 7:42 UTC (permalink / raw)
To: Ingo Molnar; +Cc: Linux Kernel List
After the loop.c fix (nfs.o and sunrpc.o waiting) I got it running here, too.
2.4.17
sched-O1-2.4.17-A0.patch
00_nanosleep-5 (Andrea)
bootmem-2.4.17-pre6 (at all IBM)
elevator-fix (Andrew, worth it for 2.4.18)
plus ReiserFS fixes
linux-2.4.17rc2-KLMN+exp_trunc+3fixes.patch
corrupt_items_checks.diff
kmalloc_cleanup.diff
O-inode-attrs.patch
To much trouble during 10_vm-21 (VM taken from 2.4.17rc2aa2) merge. So I
skipped it this time. Much wanted for 2.4.18 (best I ever had).
All the above (with preempt and 10_vm-21 AA except sched-O1-2.4.17-A0.patch)
didn't crashed before.
One system crash during the first X start up (kdeinit).
ksymoops 2.4.3 on i686 2.4.17-O1. Options used
-V (default)
-k /proc/ksyms (default)
-l /proc/modules (default)
-o /lib/modules/2.4.17-O1/ (default)
-m /boot/System.map (specified)
invalid operand: 0000
CPU: 0
EIP: 0010:[<c01194ae>] Not tainted
Using defaults from ksymoops -t elf32-i386 -a i386
EFLAGS: 00010246
eax: 00000000 ebx: c1a7ca40 ecx: c028e658 edx: dea3002c
esi: dea30000 edi: 00000000 ebp: bffff19c esp: dea31fac
ds: 0018 es: 0018 ss: 0018
Process kdeinit (pid: 961, stackpage=dea31000)
Stack: dea30000 40e1ed40 00000000 c01194ee 00000000 c0106d0b 00000000
00000001
40e208c4 40e1ed40 00000000 bffff19c 00000001 0000002b 0000002b
00000001
40da84dd 00000023 00000287 bffff170 0000002b
Call Trace: [<c01194ee>] [<c0106d0b>]
Code: 0f 0b e9 74 fe ff ff 8d 74 26 00 8d bc 27 00 00 00 00 8b 44
>>EIP; c01194ae <do_exit+1ee/200> <=====
Trace; c01194ee <sys_exit+e/10>
Trace; c0106d0a <system_call+32/38>
Code; c01194ae <do_exit+1ee/200>
00000000 <_EIP>:
Code; c01194ae <do_exit+1ee/200> <=====
0: 0f 0b ud2a <=====
Code; c01194b0 <do_exit+1f0/200>
2: e9 74 fe ff ff jmp fffffe7b <_EIP+0xfffffe7b> c0119328
<do_exit+68/200>
Code; c01194b4 <do_exit+1f4/200>
7: 8d 74 26 00 lea 0x0(%esi,1),%esi
Code; c01194b8 <do_exit+1f8/200>
b: 8d bc 27 00 00 00 00 lea 0x0(%edi,1),%edi
Code; c01194c0 <complete_and_exit+0/20>
12: 8b 44 00 00 mov 0x0(%eax,%eax,1),%eax
System runs relatively smooth but is under full system load.
7:57am up 1:36, 1 user, load average: 0.18, 0.18, 0.26
91 processes: 90 sleeping, 1 running, 0 zombie, 0 stopped
CPU states: 0.7% user, 99.2% system, 0.0% nice, 0.0% idle
Mem: 643064K av, 464212K used, 178852K free, 0K shrd, 89964K buff
Swap: 1028120K av, 3560K used, 1024560K free 179928K
cached
PID USER PRI NI SIZE RSS SHARE STAT %CPU %MEM TIME COMMAND
1263 root 52 0 138M 42M 1728 S 33.0 6.7 16:46 X
1669 nuetzel 62 0 7544 7544 4412 S 16.6 1.1 11:57 artsd
10891 nuetzel 46 0 113M 17M 12600 S 12.0 2.7 2:35 kmail
1756 nuetzel 46 0 105M 9.9M 7288 S 10.8 1.5 7:45 kmix
1455 nuetzel 45 0 109M 12M 10508 S 7.9 2.0 1:55 kdeinit
1467 nuetzel 45 0 107M 10M 8456 S 5.5 1.7 0:55 kdeinit
1414 nuetzel 45 0 105M 8916 7536 S 3.9 1.3 1:59 kdeinit
814 squid 45 0 6856 6848 1280 S 2.3 1.0 0:52 squid
6 root 45 0 0 0 0 SW 2.1 0.0 0:42 kupdated
1458 nuetzel 45 0 109M 13M 9856 S 1.3 2.0 0:44 kdeinit
11099 nuetzel 47 0 1000 1000 776 R 1.3 0.1 0:00 top
556 root 45 0 1136 1136 848 S 1.1 0.1 0:14 smpppd
1678 nuetzel 45 0 7544 7544 4412 S 0.7 1.1 0:12 artsd
494 root 45 0 3072 3072 1776 S 0.3 0.4 0:18 named
1451 root 45 0 6860 6852 1416 S 0.1 1.0 0:14 xperfmon++
10871 nuetzel 45 0 111M 14M 11680 S 0.1 2.3 0:14 kdeinit
1 root 46 0 212 212 176 S 0.0 0.0 0:06 init
/home/nuetzel> procinfo
Linux 2.4.17-O1 (root@SunWave1) (gcc 2.95.3 20010315 ) #1 1CPU [SunWave1.]
Memory: Total Used Free Shared Buffers Cached
Mem: 643064 452988 190076 0 100096 183148
Swap: 1028120 3560 1024560
Bootup: Fri Jan 4 06:21:02 2002 Load average: 0.14 0.32 0.31
1894046082/90 11460
user : 0:16:59.19 14.9% page in : 404106 disk 1: 31792r
70750w
nice : 0:00:00.00 0.0% page out: 2580336 disk 2: 137r
225w
system: 1:19:41.05 70.0% swap in : 2 disk 3: 1r
0w
idle : 0:17:11.67 15.1% swap out: 695 disk 4: 1009r
0w
uptime: 1:53:51.90 context : 2427806
irq 0: 683191 timer irq 8: 154583 rtc
irq 1: 12567 keyboard irq 9: 0 acpi, usb-ohci
irq 2: 0 cascade [4] irq 10: 103402 aic7xxx
irq 5: 9333 eth1 irq 11: 310704 eth0, EMU10K1
irq 7: 115 parport0 [3] irq 12: 136392 PS/2 Mouse
More processes die during second and third boot...
I have some more crash logs if needed.
Preempt plus lock-break is better for now.
latencytest0.42-png crash the system.
What next?
Maybe a combination of O(1) and preempt?
--
Dieter Nützel
Graduate Student, Computer Science
University of Hamburg
Department of Computer Science
@home: Dieter.Nuetzel@hamburg.de
^ permalink raw reply [flat|nested] 65+ messages in thread* Re: [announce] [patch] ultra-scalable O(1) SMP and UP scheduler
2002-01-04 7:42 Dieter Nützel
@ 2002-01-04 8:02 ` David Lang
2002-01-04 11:44 ` Ingo Molnar
0 siblings, 1 reply; 65+ messages in thread
From: David Lang @ 2002-01-04 8:02 UTC (permalink / raw)
To: Dieter Nützel; +Cc: Ingo Molnar, Linux Kernel List
Ingo,
back in the 2.4.4-2.4.5 days when we experimented with the
child-runs-first scheduling patch we ran into quite a few programs that
died or locked up due to this. (I had a couple myself and heard of others)
try switching this back to the current behaviour and see if the lockups
still happen.
David Lang
On Fri, 4 Jan 2002, Dieter [iso-8859-15] Nützel wrote:
> Date: Fri, 4 Jan 2002 08:42:37 +0100
> From: "Dieter [iso-8859-15] Nützel" <Dieter.Nuetzel@hamburg.de>
> To: Ingo Molnar <mingo@elte.hu>
> Cc: Linux Kernel List <linux-kernel@vger.kernel.org>
> Subject: Re: [announce] [patch] ultra-scalable O(1) SMP and UP scheduler
>
> After the loop.c fix (nfs.o and sunrpc.o waiting) I got it running here, too.
>
> 2.4.17
> sched-O1-2.4.17-A0.patch
> 00_nanosleep-5 (Andrea)
> bootmem-2.4.17-pre6 (at all IBM)
> elevator-fix (Andrew, worth it for 2.4.18)
>
> plus ReiserFS fixes
> linux-2.4.17rc2-KLMN+exp_trunc+3fixes.patch
> corrupt_items_checks.diff
> kmalloc_cleanup.diff
> O-inode-attrs.patch
>
> To much trouble during 10_vm-21 (VM taken from 2.4.17rc2aa2) merge. So I
> skipped it this time. Much wanted for 2.4.18 (best I ever had).
>
> All the above (with preempt and 10_vm-21 AA except sched-O1-2.4.17-A0.patch)
> didn't crashed before.
>
> One system crash during the first X start up (kdeinit).
>
> ksymoops 2.4.3 on i686 2.4.17-O1. Options used
> -V (default)
> -k /proc/ksyms (default)
> -l /proc/modules (default)
> -o /lib/modules/2.4.17-O1/ (default)
> -m /boot/System.map (specified)
>
> invalid operand: 0000
> CPU: 0
> EIP: 0010:[<c01194ae>] Not tainted
> Using defaults from ksymoops -t elf32-i386 -a i386
> EFLAGS: 00010246
> eax: 00000000 ebx: c1a7ca40 ecx: c028e658 edx: dea3002c
> esi: dea30000 edi: 00000000 ebp: bffff19c esp: dea31fac
> ds: 0018 es: 0018 ss: 0018
> Process kdeinit (pid: 961, stackpage=dea31000)
> Stack: dea30000 40e1ed40 00000000 c01194ee 00000000 c0106d0b 00000000
> 00000001
> 40e208c4 40e1ed40 00000000 bffff19c 00000001 0000002b 0000002b
> 00000001
> 40da84dd 00000023 00000287 bffff170 0000002b
> Call Trace: [<c01194ee>] [<c0106d0b>]
> Code: 0f 0b e9 74 fe ff ff 8d 74 26 00 8d bc 27 00 00 00 00 8b 44
>
> >>EIP; c01194ae <do_exit+1ee/200> <=====
> Trace; c01194ee <sys_exit+e/10>
> Trace; c0106d0a <system_call+32/38>
> Code; c01194ae <do_exit+1ee/200>
> 00000000 <_EIP>:
> Code; c01194ae <do_exit+1ee/200> <=====
> 0: 0f 0b ud2a <=====
> Code; c01194b0 <do_exit+1f0/200>
> 2: e9 74 fe ff ff jmp fffffe7b <_EIP+0xfffffe7b> c0119328
> <do_exit+68/200>
> Code; c01194b4 <do_exit+1f4/200>
> 7: 8d 74 26 00 lea 0x0(%esi,1),%esi
> Code; c01194b8 <do_exit+1f8/200>
> b: 8d bc 27 00 00 00 00 lea 0x0(%edi,1),%edi
> Code; c01194c0 <complete_and_exit+0/20>
> 12: 8b 44 00 00 mov 0x0(%eax,%eax,1),%eax
>
> System runs relatively smooth but is under full system load.
>
> 7:57am up 1:36, 1 user, load average: 0.18, 0.18, 0.26
> 91 processes: 90 sleeping, 1 running, 0 zombie, 0 stopped
> CPU states: 0.7% user, 99.2% system, 0.0% nice, 0.0% idle
> Mem: 643064K av, 464212K used, 178852K free, 0K shrd, 89964K buff
> Swap: 1028120K av, 3560K used, 1024560K free 179928K
> cached
>
> PID USER PRI NI SIZE RSS SHARE STAT %CPU %MEM TIME COMMAND
> 1263 root 52 0 138M 42M 1728 S 33.0 6.7 16:46 X
> 1669 nuetzel 62 0 7544 7544 4412 S 16.6 1.1 11:57 artsd
> 10891 nuetzel 46 0 113M 17M 12600 S 12.0 2.7 2:35 kmail
> 1756 nuetzel 46 0 105M 9.9M 7288 S 10.8 1.5 7:45 kmix
> 1455 nuetzel 45 0 109M 12M 10508 S 7.9 2.0 1:55 kdeinit
> 1467 nuetzel 45 0 107M 10M 8456 S 5.5 1.7 0:55 kdeinit
> 1414 nuetzel 45 0 105M 8916 7536 S 3.9 1.3 1:59 kdeinit
> 814 squid 45 0 6856 6848 1280 S 2.3 1.0 0:52 squid
> 6 root 45 0 0 0 0 SW 2.1 0.0 0:42 kupdated
> 1458 nuetzel 45 0 109M 13M 9856 S 1.3 2.0 0:44 kdeinit
> 11099 nuetzel 47 0 1000 1000 776 R 1.3 0.1 0:00 top
> 556 root 45 0 1136 1136 848 S 1.1 0.1 0:14 smpppd
> 1678 nuetzel 45 0 7544 7544 4412 S 0.7 1.1 0:12 artsd
> 494 root 45 0 3072 3072 1776 S 0.3 0.4 0:18 named
> 1451 root 45 0 6860 6852 1416 S 0.1 1.0 0:14 xperfmon++
> 10871 nuetzel 45 0 111M 14M 11680 S 0.1 2.3 0:14 kdeinit
> 1 root 46 0 212 212 176 S 0.0 0.0 0:06 init
>
> /home/nuetzel> procinfo
> Linux 2.4.17-O1 (root@SunWave1) (gcc 2.95.3 20010315 ) #1 1CPU [SunWave1.]
>
> Memory: Total Used Free Shared Buffers Cached
> Mem: 643064 452988 190076 0 100096 183148
> Swap: 1028120 3560 1024560
>
> Bootup: Fri Jan 4 06:21:02 2002 Load average: 0.14 0.32 0.31
> 1894046082/90 11460
>
> user : 0:16:59.19 14.9% page in : 404106 disk 1: 31792r
> 70750w
> nice : 0:00:00.00 0.0% page out: 2580336 disk 2: 137r
> 225w
> system: 1:19:41.05 70.0% swap in : 2 disk 3: 1r
> 0w
> idle : 0:17:11.67 15.1% swap out: 695 disk 4: 1009r
> 0w
> uptime: 1:53:51.90 context : 2427806
>
> irq 0: 683191 timer irq 8: 154583 rtc
> irq 1: 12567 keyboard irq 9: 0 acpi, usb-ohci
> irq 2: 0 cascade [4] irq 10: 103402 aic7xxx
> irq 5: 9333 eth1 irq 11: 310704 eth0, EMU10K1
> irq 7: 115 parport0 [3] irq 12: 136392 PS/2 Mouse
>
> More processes die during second and third boot...
> I have some more crash logs if needed.
>
> Preempt plus lock-break is better for now.
> latencytest0.42-png crash the system.
>
> What next?
> Maybe a combination of O(1) and preempt?
>
> --
> Dieter Nützel
> Graduate Student, Computer Science
>
> University of Hamburg
> Department of Computer Science
> @home: Dieter.Nuetzel@hamburg.de
>
> -
> To unsubscribe from this list: send the line "unsubscribe linux-kernel" in
> the body of a message to majordomo@vger.kernel.org
> More majordomo info at http://vger.kernel.org/majordomo-info.html
> Please read the FAQ at http://www.tux.org/lkml/
>
^ permalink raw reply [flat|nested] 65+ messages in thread
* Re: [announce] [patch] ultra-scalable O(1) SMP and UP scheduler
  2002-01-04  8:02 ` David Lang
@ 2002-01-04 11:44   ` Ingo Molnar
  2002-01-04 11:33     ` David Lang
  2002-01-04 13:36     ` Andrea Arcangeli
  0 siblings, 2 replies; 65+ messages in thread
From: Ingo Molnar @ 2002-01-04 11:44 UTC (permalink / raw)
  To: David Lang; +Cc: Dieter Nützel, Linux Kernel List, Andrea Arcangeli


On Fri, 4 Jan 2002, David Lang wrote:

> Ingo,
> back in the 2.4.4-2.4.5 days when we experimented with the
> child-runs-first scheduling patch we ran into quite a few programs that
> died or locked up due to this. (I had a couple myself and heard of others)

hm, Andrea said that the only serious issue was in the sysvinit code,
which should be fixed in any recent distro. Andrea?

> try switching this back to the current behaviour and see if the
> lockups still happen.

there must be some other bug as well, the child-runs-first scheduling can
cause lockups, but it shouldnt cause oopes.

	Ingo


^ permalink raw reply	[flat|nested] 65+ messages in thread
* Re: [announce] [patch] ultra-scalable O(1) SMP and UP scheduler
  2002-01-04 11:44   ` Ingo Molnar
@ 2002-01-04 11:33     ` David Lang
  2002-01-04 13:39       ` Andrea Arcangeli
  2002-01-04 14:04       ` Ingo Molnar
  2002-01-04 13:36     ` Andrea Arcangeli
  1 sibling, 2 replies; 65+ messages in thread
From: David Lang @ 2002-01-04 11:33 UTC (permalink / raw)
  To: Ingo Molnar; +Cc: Dieter Nutzel, Linux Kernel List, Andrea Arcangeli

On Fri, 4 Jan 2002, Ingo Molnar wrote:

> On Fri, 4 Jan 2002, David Lang wrote:
>
> > Ingo,
> > back in the 2.4.4-2.4.5 days when we experimented with the
> > child-runs-first scheduling patch we ran into quite a few programs that
> > died or locked up due to this. (I had a couple myself and heard of others)
>
> hm, Andrea said that the only serious issue was in the sysvinit code,
> which should be fixed in any recent distro. Andrea?
>

I remember running into problems with some user apps (not lockups, but the
apps failed) on my 2x400MHz pentium box. I specificly remember the Citrix
client hanging, but I think there were others as well.

I'll try and get a chance to try your patch in the next couple days.

David Lang


 > > try switching this back to the current behaviour and
see if the > > lockups still happen.
>
> there must be some other bug as well, the child-runs-first scheduling can
> cause lockups, but it shouldnt cause oopes.
>
> 	Ingo
>

^ permalink raw reply	[flat|nested] 65+ messages in thread
* Re: [announce] [patch] ultra-scalable O(1) SMP and UP scheduler
  2002-01-04 11:33     ` David Lang
@ 2002-01-04 13:39       ` Andrea Arcangeli
  2002-01-04 14:04       ` Ingo Molnar
  1 sibling, 0 replies; 65+ messages in thread
From: Andrea Arcangeli @ 2002-01-04 13:39 UTC (permalink / raw)
  To: David Lang; +Cc: Ingo Molnar, Dieter Nutzel, Linux Kernel List

On Fri, Jan 04, 2002 at 03:33:19AM -0800, David Lang wrote:
> On Fri, 4 Jan 2002, Ingo Molnar wrote:
>
> > On Fri, 4 Jan 2002, David Lang wrote:
> >
> > > Ingo,
> > > back in the 2.4.4-2.4.5 days when we experimented with the
> > > child-runs-first scheduling patch we ran into quite a few programs that
> > > died or locked up due to this. (I had a couple myself and heard of others)
> >
> > hm, Andrea said that the only serious issue was in the sysvinit code,
> > which should be fixed in any recent distro. Andrea?
> >
>
> I remember running into problems with some user apps (not lockups, but the
> apps failed) on my 2x400MHz pentium box. I specificly remember the Citrix
> client hanging, but I think there were others as well.

those are broken apps that have to be fixed, they will eventually lockup
even without the patch. userspace can be preempted anytime.

> I'll try and get a chance to try your patch in the next couple days.
>
> David Lang
>
>
>  > > try switching this back to the current behaviour and
> see if the > > lockups still happen.
> >
> > there must be some other bug as well, the child-runs-first scheduling can
> > cause lockups, but it shouldnt cause oopes.
> >
> > 	Ingo
> >


Andrea

^ permalink raw reply	[flat|nested] 65+ messages in thread
* Re: [announce] [patch] ultra-scalable O(1) SMP and UP scheduler
  2002-01-04 11:33     ` David Lang
  2002-01-04 13:39       ` Andrea Arcangeli
@ 2002-01-04 14:04       ` Ingo Molnar
  1 sibling, 0 replies; 65+ messages in thread
From: Ingo Molnar @ 2002-01-04 14:04 UTC (permalink / raw)
  To: David Lang; +Cc: Dieter Nutzel, Linux Kernel List, Andrea Arcangeli


On Fri, 4 Jan 2002, David Lang wrote:

> I remember running into problems with some user apps (not lockups, but
> the apps failed) on my 2x400MHz pentium box. I specificly remember the
> Citrix client hanging, but I think there were others as well.

ok. Generally there is no guarantee that the parent will run first under
the current scheduler, but it's likely to run first. But if eg. a higher
priority process preempts the forking process while it's doing fork() then
the child will run first in 50% of the cases. So this ordering is not
guaranteed by the 2.4 (or 2.2) Linux scheduler in any way.

	Ingo


^ permalink raw reply	[flat|nested] 65+ messages in thread
* Re: [announce] [patch] ultra-scalable O(1) SMP and UP scheduler
  2002-01-04 11:44   ` Ingo Molnar
  2002-01-04 11:33     ` David Lang
@ 2002-01-04 13:36     ` Andrea Arcangeli
  2002-01-04 15:44       ` Ingo Molnar
  1 sibling, 1 reply; 65+ messages in thread
From: Andrea Arcangeli @ 2002-01-04 13:36 UTC (permalink / raw)
  To: Ingo Molnar; +Cc: David Lang, Dieter Nützel, Linux Kernel List

On Fri, Jan 04, 2002 at 12:44:57PM +0100, Ingo Molnar wrote:
>
> On Fri, 4 Jan 2002, David Lang wrote:
>
> > Ingo,
> > back in the 2.4.4-2.4.5 days when we experimented with the
> > child-runs-first scheduling patch we ran into quite a few programs that
> > died or locked up due to this. (I had a couple myself and heard of others)
>
> hm, Andrea said that the only serious issue was in the sysvinit code,
> which should be fixed in any recent distro. Andrea?

correct. I run child-run-first always on all my boxes. And
those races could trigger also before, so it's better to make them more
easily reproducible anyways.

I always run with this patch applied:

diff -urN parent-timeslice/include/linux/sched.h child-first/include/linux/sched.h
--- parent-timeslice/include/linux/sched.h	Thu May  3 18:17:56 2001
+++ child-first/include/linux/sched.h	Thu May  3 18:19:44 2001
@@ -301,7 +301,7 @@
  * all fields in a single cacheline that are needed for
  * the goodness() loop in schedule().
  */
-	int counter;
+	volatile int counter;
 	int nice;
 	unsigned int policy;
 	struct mm_struct *mm;
diff -urN parent-timeslice/kernel/fork.c child-first/kernel/fork.c
--- parent-timeslice/kernel/fork.c	Thu May  3 18:18:31 2001
+++ child-first/kernel/fork.c	Thu May  3 18:20:40 2001
@@ -665,15 +665,18 @@
 	p->pdeath_signal = 0;

 	/*
-	 * "share" dynamic priority between parent and child, thus the
-	 * total amount of dynamic priorities in the system doesnt change,
-	 * more scheduling fairness. This is only important in the first
-	 * timeslice, on the long run the scheduling behaviour is unchanged.
+	 * Scheduling the child first is especially useful in avoiding a
+	 * lot of copy-on-write faults if the child for a fork() just wants
+	 * to do a few simple things and then exec().
 	 */
-	p->counter = (current->counter + 1) >> 1;
-	current->counter >>= 1;
-	if (!current->counter)
+	{
+		int counter = current->counter;
+		p->counter = (counter + 1) >> 1;
+		current->counter = counter >> 1;
+		p->policy &= ~SCHED_YIELD;
+		current->policy |= SCHED_YIELD;
 		current->need_resched = 1;
+	}

 	/* Tell the parent if it can get back its timeslice when child exits */
 	p->get_child_timeslice = 1;

>
> > try switching this back to the current behaviour and see if the
> > lockups still happen.
>
> there must be some other bug as well, the child-runs-first scheduling can
> cause lockups, but it shouldnt cause oopes.

definitely. My above implementation works fine.

Andrea

^ permalink raw reply	[flat|nested] 65+ messages in thread
* Re: [announce] [patch] ultra-scalable O(1) SMP and UP scheduler
2002-01-04 13:36 ` Andrea Arcangeli
@ 2002-01-04 15:44 ` Ingo Molnar
2002-01-04 14:45 ` Andrea Arcangeli
0 siblings, 1 reply; 65+ messages in thread
From: Ingo Molnar @ 2002-01-04 15:44 UTC (permalink / raw)
To: Andrea Arcangeli; +Cc: David Lang, Dieter Nützel, Linux Kernel List
On Fri, 4 Jan 2002, Andrea Arcangeli wrote:
> + {
> + int counter = current->counter;
> + p->counter = (counter + 1) >> 1;
> + current->counter = counter >> 1;
> + p->policy &= ~SCHED_YIELD;
> + current->policy |= SCHED_YIELD;
> current->need_resched = 1;
> + }
yep - good, this means that applications got some fair testing already.
What i mentioned in the previous email is that on SMP this solution is
still not the optimal one under the current scheduler, because the wakeup
of the child process might end up pushing the process to another (idle)
CPU - worsening the COW effect with SMP-interlocking effects. This is why
i introduced wake_up_forked_process() that knows about this distinction
and keeps the child on the current CPU.
Ingo
^ permalink raw reply [flat|nested] 65+ messages in thread* Re: [announce] [patch] ultra-scalable O(1) SMP and UP scheduler
2002-01-04 15:44 ` Ingo Molnar
@ 2002-01-04 14:45 ` Andrea Arcangeli
0 siblings, 0 replies; 65+ messages in thread
From: Andrea Arcangeli @ 2002-01-04 14:45 UTC (permalink / raw)
To: Ingo Molnar; +Cc: David Lang, Dieter Nützel, Linux Kernel List
On Fri, Jan 04, 2002 at 04:44:32PM +0100, Ingo Molnar wrote:
>
> On Fri, 4 Jan 2002, Andrea Arcangeli wrote:
>
> > + {
> > + int counter = current->counter;
> > + p->counter = (counter + 1) >> 1;
> > + current->counter = counter >> 1;
> > + p->policy &= ~SCHED_YIELD;
> > + current->policy |= SCHED_YIELD;
> > current->need_resched = 1;
> > + }
>
> yep - good, this means that applications got some fair testing already.
yes :).
> What i mentioned in the previous email is that on SMP this solution is
> still not the optimal one under the current scheduler, because the wakeup
> of the child process might end up pushing the process to another (idle)
> CPU - worsening the COW effect with SMP-interlocking effects. This is why
> i introduced wake_up_forked_process() that knows about this distinction
> and keeps the child on the current CPU.
The right thing to do is not obvious here. If you keep the parent on the
current CPU, it will be the parent that will be rescheduled on another
(idle) cpu. But then the parent could be the "real" app, or something
that would better not migrate over and over to all cpus (better to run
the child in another cpu in such case). Of course we cannot avoid child
and parent to run in parallel if there are idle cpus or we risk to waste
a whole timeslice worth of cpu cycles. But, at the very least we should
avoid to set need_resched to 1 in the parent if the child is getting
migrated, so at least that bit can be optimized away with an aware
wake_up_forked_process.
Andrea
^ permalink raw reply [flat|nested] 65+ messages in thread
* Re: [announce] [patch] ultra-scalable O(1) SMP and UP scheduler
@ 2002-01-04 11:16 rwhron
  2002-01-04 13:20 ` Ingo Molnar
  0 siblings, 1 reply; 65+ messages in thread
From: rwhron @ 2002-01-04 11:16 UTC (permalink / raw)
  To: mingo; +Cc: linux-kernel

Ingo,

I tried the new scheduler with the kdev_t patch you mentioned and it
went very well for a long time.  dbench 64, 128, 192 all completed,
3 iterations of bonnie++ were fine too.

When I ran the syscalls test from the http://ltp.sf.net/ I had a
few problems.

The first time the machine rebooted.  The last thing in the logfile
was that pipe11 test was running.  I believe it got past that point.
(the syscall tests run in alphabetic order).

The second time I ran it, when I was tailing the output the
machine seemed to freeze.  (Usually the syscall tests complete
very quickly).  I got the oops below on a serial console, it
scrolled much longer and didn't seem to like the call trace
would ever complete, so i rebooted.

I ran it a third time trying to isolate which test triggered the oops,
but the behavior was different again.  The machine got very very
slow, but tests would eventually print their output.  The test that
triggered the behavior was apparently between pipe11 and the setrlimit01
command below.

Here is top in the locked state:

33 processes: 23 sleeping, 4 running, 6 zombie, 0 stopped
CPU states:  0.3% user,  0.0% system,  0.0% nice, 99.6% idle
Mem:   385344K av,   83044K used,  302300K free,       0K shrd,   51976K buff
Swap:  152608K av,       0K used,  152608K free                   16564K cached

  PID USER     PRI  NI  SIZE  RSS SHARE STAT %CPU %MEM   TIME COMMAND
   50 root      55   0  1620 1620  1404 R     0.1  0.4   0:05 sshd
 8657 root      47   0   948  948   756 R     0.1  0.2   0:00 top
    1 root      46   0   524  524   452 S     0.0  0.1   0:06 init
    2 root      63   0     0    0     0 SW    0.0  0.0   0:00 keventd
    3 root      63  19     0    0     0 RWN   0.0  0.0   0:00 ksoftirqd_CPU0
    4 root      63   0     0    0     0 SW    0.0  0.0   0:00 kswapd
    5 root      63   0     0    0     0 SW    0.0  0.0   0:00 bdflush
    6 root      47   0     0    0     0 SW    0.0  0.0   0:00 kupdated
    7 root      45   0     0    0     0 SW    0.0  0.0   0:00 kreiserfsd
   28 root      45   0   620  620   516 S     0.0  0.1   0:00 syslogd
   31 root      46   0   480  480   404 S     0.0  0.1   0:00 klogd
   35 root      47   0     0    0     0 SW    0.0  0.0   0:00 eth0
   40 root      49   0   816  816   664 S     0.0  0.2   0:00 iplog
   41 root      46   0   816  816   664 S     0.0  0.2   0:00 iplog
   42 root      45   0   816  816   664 S     0.0  0.2   0:00 iplog
   43 root      45   0   816  816   664 S     0.0  0.2   0:00 iplog
   44 root      58   0   816  816   664 S     0.0  0.2   0:01 iplog
   46 root      53   0  1276 1276  1156 S     0.0  0.3   0:00 sshd
   48 root      46   0   472  472   396 S     0.0  0.1   0:00 agetty
   51 hrandoz   49   0  1164 1164   892 S     0.0  0.3   0:00 bash
   59 root      46   0  1184 1184  1028 S     0.0  0.3   0:00 bash
  702 root      45   0  1224 1224  1028 S     0.0  0.3   0:01 bash
 8564 root      63   0  1596 1596  1404 S     0.0  0.4   0:00 sshd
 8602 root      46   0   472  472   396 S     0.0  0.1   0:00 agetty
 8616 hrandoz   63   0  1164 1164   892 S     0.0  0.3   0:00 bash
 8645 root      49   0  1152 1152   888 S     0.0  0.2   0:00 bash
 8647 root      46   0   468  468   388 R     0.0  0.1   0:00 setrlimit01
 8649 root      46   0     0    0     0 Z     0.0  0.0   0:00 setrlimit01 <defunct>
 8650 root      46   0     0    0     0 Z     0.0  0.0   0:00 setrlimit01 <defunct>
 8651 root      46   0     0    0     0 Z     0.0  0.0   0:00 setrlimit01 <defunct>
 8658 root      46   0     0    0     0 Z     0.0  0.0   0:00 setrlimit01 <defunct>
 8659 root      46   0     0    0     0 Z     0.0  0.0   0:00 setrlimit01 <defunct>
 8660 root      46   0     0    0     0 Z     0.0  0.0   0:00 setrlimit01 <defunct>

No modules in ksyms, skipping objects
Warning (read_lsmod): no symbols in lsmod, is /proc/modules a valid lsmod file?
 Unable to handle kernel NULL pointer dereference at virtual address 00000000
*pde = c024be44
Oops: 0002
CPU:    0
EIP:    0010:[<c024c06d>]    Not tainted
Using defaults from ksymoops -t elf32-i386 -a i386
EFLAGS: 00010046
eax: 00000000   ebx: d6184000   ecx: d6184290   edx: d6184290
esi: c024be3c   edi: d6184001   ebp: d6185f98   esp: c024c06c
ds: 0018   es: 0018   ss: 0018
Process  (pid: 0, stackpage=c024b000)
Stack: c024c06c c024c06c c024c074 c024c074 c024c07c c024c07c c024c084 c024c084
       c024c08c c024c08c c024c094 c024c094 c024c09c c024c09c c024c0a4 c024c0a4
       c024c0ac c024c0ac c024c0b4 c024c0b4 c024c0bc c024c0bc c024c0c4 c024c0c4
Code: c0 24 c0 6c c0 24 c0 74 c0 24 c0 74 c0 24 c0 7c c0 24 c0 7c

>>EIP; c024c06c <rt_array+28c/340>   <=====
Code;  c024c06c <rt_array+28c/340>
00000000 <_EIP>:
Code;  c024c06c <rt_array+28c/340>   <=====
   0:   c0 24 c0 6c               shlb   $0x6c,(%eax,%eax,8)   <=====
Code;  c024c070 <rt_array+290/340>
   4:   c0 24 c0 74               shlb   $0x74,(%eax,%eax,8)
Code;  c024c074 <rt_array+294/340>
   8:   c0 24 c0 74               shlb   $0x74,(%eax,%eax,8)
Code;  c024c078 <rt_array+298/340>
   c:   c0 24 c0 7c               shlb   $0x7c,(%eax,%eax,8)
Code;  c024c07c <rt_array+29c/340>
  10:   c0 24 c0 7c               shlb   $0x7c,(%eax,%eax,8)

CPU:    0
EIP:    0010:[<c01110b5>]    Not tainted
EFLAGS: 00010086
eax: c0000000   ebx: c0248000   ecx: c024ca58   edx: 01400000
esi: 00000000   edi: c0110c48   ebp: c1400000   esp: c0247fb8
ds: 0018   es: 0018   ss: 0018
Process $.#. (pid: 5373, stackpage=c0247000)
Stack: c0248000 00000000 c0110c48 c1400000 00000000 00000000 c0246000 00000000
       00000000 00000000 00000000 00000000 00000000 00000000 00000000 00000000
       00000000 00000000
Call Trace: [<c0110c48>]
Code: f6 04 10 81 0f 84 02 fe ff ff 5b 5e 5f 5d 81 c4 8c 00 00 00

>>EIP; c01110b4 <do_page_fault+46c/488>   <=====
Trace; c0110c48 <do_page_fault+0/488>
Code;  c01110b4 <do_page_fault+46c/488>
00000000 <_EIP>:
Code;  c01110b4 <do_page_fault+46c/488>   <=====
   0:   f6 04 10 81               testb  $0x81,(%eax,%edx,1)   <=====
Code;  c01110b8 <do_page_fault+470/488>
   4:   0f 84 02 fe ff ff         je     fffffe0c <_EIP+0xfffffe0c> c0110ec0 <do_page_fault+278/488>
Code;  c01110be <do_page_fault+476/488>
   a:   5b                        pop    %ebx
Code;  c01110be <do_page_fault+476/488>
   b:   5e                        pop    %esi
Code;  c01110c0 <do_page_fault+478/488>
   c:   5f                        pop    %edi
Code;  c01110c0 <do_page_fault+478/488>
   d:   5d                        pop    %ebp
Code;  c01110c2 <do_page_fault+47a/488>
   e:   81 c4 8c 00 00 00         add    $0x8c,%esp

CPU:    0
EIP:    0010:[<c0180e93>]    Not tainted
EFLAGS: 00010002
eax: c1604120   ebx: 00000000   ecx: c0203cc0   edx: 00000000
esi: 00000000   edi: c0108e1c   ebp: c1400000   esp: c0247f30
ds: 0018   es: 0018   ss: 0018
Process $.#. (pid: 5373, stackpage=c0247000)
Stack: 0000000f 00000000 c0110bfb 00000000 c0108afe 00000000 c0247f84 c01dcccd
       c01dcd1f 00000000 00000001 c0247f84 c0108e70 c01dcd1f c0247f84 00000000
       c0246000 00000000 c0108684 c0247f84 00000000 c0248000 c024ca58 01400000
Call Trace: [<c0110bfb>] [<c0108afe>] [<c0108e70>] [<c0108684>] [<c0110c48>]
   [<c01110b5>] [<c0110c48>]
Code: 80 78 04 00 75 7f 8b 15 a0 90 20 c0 c7 05 44 1c 26 c0 1c 0f

>>EIP; c0180e92 <unblank_screen+4e/d8>   <=====
Trace; c0110bfa <bust_spinlocks+22/4c>
Trace; c0108afe <die+42/50>
Trace; c0108e70 <do_double_fault+54/5c>
Trace; c0108684 <error_code+34/40>
Trace; c0110c48 <do_page_fault+0/488>
Trace; c01110b4 <do_page_fault+46c/488>
Trace; c0110c48 <do_page_fault+0/488>
Code;  c0180e92 <unblank_screen+4e/d8>
00000000 <_EIP>:
Code;  c0180e92 <unblank_screen+4e/d8>   <=====
   0:   80 78 04 00               cmpb   $0x0,0x4(%eax)   <=====
Code;  c0180e96 <unblank_screen+52/d8>
   4:   75 7f                     jne    85 <_EIP+0x85> c0180f16 <unblank_screen+d2/d8>
Code;  c0180e98 <unblank_screen+54/d8>
   6:   8b 15 a0 90 20 c0         mov    0xc02090a0,%edx
Code;  c0180e9e <unblank_screen+5a/d8>
   c:   c7 05 44 1c 26 c0 1c      movl   $0xf1c,0xc0261c44
Code;  c0180ea4 <unblank_screen+60/d8>
  13:   0f 00 00

CPU:    0
EIP:    0010:[<c0180e93>]    Not tainted
EFLAGS: 00010002
eax: c1604120   ebx: 00000000   ecx: c0203cc0   edx: 00000000
esi: 00000000   edi: c0108e1c   ebp: c1400000   esp: c0247ea8
ds: 0018   es: 0018   ss: 0018
Process $.#. (pid: 5373, stackpage=c0247000)
Stack: 0000000f 00000000 c0110bfb 00000000 c0108afe 00000000 c0247efc c01dcccd
       c01dcd1f 00000000 00000001 c0247efc c0108e70 c01dcd1f c0247efc 00000000
       c0246000 00000000 c0108684 c0247efc 00000000 00000000 c0203cc0 00000000
Call Trace: [<c0110bfb>] [<c0108afe>] [<c0108e70>] [<c0108684>] [<c0108e1c>]
   [<c0180e93>] [<c0110bfb>] [<c0108afe>] [<c0108e70>] [<c0108684>] [<c0110c48>]
   [<c01110b5>] [<c0110c48>]
Code: 80 78 04 00 75 7f 8b 15 a0 90 20 c0 c7 05 44 1c 26 c0 1c 0f


It looks like you already have an idea where the problem is.
Looking forward to the next patch.  :)
--
Randy Hron


^ permalink raw reply	[flat|nested] 65+ messages in thread
* Re: [announce] [patch] ultra-scalable O(1) SMP and UP scheduler
2002-01-04 11:16 rwhron
@ 2002-01-04 13:20 ` Ingo Molnar
0 siblings, 0 replies; 65+ messages in thread
From: Ingo Molnar @ 2002-01-04 13:20 UTC (permalink / raw)
To: rwhron; +Cc: linux-kernel
On Fri, 4 Jan 2002, rwhron wrote:
> The second time I ran it, when I was tailing the output the machine
> seemed to freeze. (Usually the syscall tests complete very quickly).
> I got the oops below on a serial console, it scrolled much longer and
> didn't seem to like the call trace would ever complete, so i rebooted.
the oops shows an infinite page fault, the actual point of fault is not
visible. To make it visible, could you please apply the following patch to
your tree and check the serial console? It should now just print a single
line (showing the faulting EIP) and freeze forever:
pagefault at: 12341234. locking up now.
Please look up the EIP via gdb:
gdb ./vmlinux
list *0x12341234
(for this you'll have to add '-g' to CFLAGS in the top level Makefile.)
> I ran it a third time trying to isolate which test triggered the oops,
> but the behavior was different again. The machine got very very slow,
> but tests would eventually print their output. The test that
> triggered the behavior was apparently between pipe11 and the
> setrlimit01 command below.
i'll try these tests. Does the test use RT scheduling as well?
> It looks like you already have an idea where the problem is.
> Looking forward to the next patch. :)
i havent found the bug yet :-|
Ingo
--- linux/arch/i386/mm/fault.c.orig Fri Jan 4 12:08:41 2002
+++ linux/arch/i386/mm/fault.c Fri Jan 4 12:11:09 2002
@@ -314,6 +314,8 @@
* Oops. The kernel tried to access some bad page. We'll have to
* terminate things with extreme prejudice.
*/
+ printk("pagefault at: %08lx. locking up now.\n", regs->eip);
+ for (;;) __cli();
bust_spinlocks(1);
^ permalink raw reply [flat|nested] 65+ messages in thread
[parent not found: <20020104074239.94E016DAA6@mail.elte.hu>]
* Re: [announce] [patch] ultra-scalable O(1) SMP and UP scheduler
       [not found] <20020104074239.94E016DAA6@mail.elte.hu>
@ 2002-01-04 11:42 ` Ingo Molnar
  2002-01-05  0:28   ` Roger Larsson
  0 siblings, 1 reply; 65+ messages in thread
From: Ingo Molnar @ 2002-01-04 11:42 UTC (permalink / raw)
  To: Dieter Nützel; +Cc: Linux Kernel List


On Fri, 4 Jan 2002, Dieter [iso-8859-15] Nützel wrote:

> What next? Maybe a combination of O(1) and preempt?

yes, fast preemption of kernel-mode tasks and the scheduler code are
almost orthogonal. So i agree that to get the best interactive performance
we need both.

	Ingo

ps. i'm working on fixing the crashes you saw.


^ permalink raw reply	[flat|nested] 65+ messages in thread
* Re: [announce] [patch] ultra-scalable O(1) SMP and UP scheduler
2002-01-04 11:42 ` Ingo Molnar
@ 2002-01-05 0:28 ` Roger Larsson
2002-01-05 7:53 ` george anzinger
2002-01-05 12:42 ` Ingo Molnar
0 siblings, 2 replies; 65+ messages in thread
From: Roger Larsson @ 2002-01-05 0:28 UTC (permalink / raw)
To: mingo, Dieter Nützel; +Cc: Linux Kernel List
On Fridayen den 4 January 2002 12.42, Ingo Molnar wrote:
> On Fri, 4 Jan 2002, Dieter [iso-8859-15] Nützel wrote:
> > What next? Maybe a combination of O(1) and preempt?
>
> yes, fast preemption of kernel-mode tasks and the scheduler code are
> almost orthogonal. So i agree that to get the best interactive performance
> we need both.
>
> Ingo
>
> ps. i'm working on fixing the crashes you saw.
>
> -
> To unsubscribe from this list: send the line "unsubscribe linux-kernel" in
> the body of a message to majordomo@vger.kernel.org
> More majordomo info at http://vger.kernel.org/majordomo-info.html
> Please read the FAQ at http://www.tux.org/lkml/
Ingo,
The preemtion kernel adds protection to per process data...
And it is not (yet) updated to handle the O(1) scheduler!
/RogerL
--
Roger Larsson
Skellefteå
Sweden
^ permalink raw reply [flat|nested] 65+ messages in thread
* Re: [announce] [patch] ultra-scalable O(1) SMP and UP scheduler
  2002-01-05  0:28   ` Roger Larsson
@ 2002-01-05  7:53     ` george anzinger
  2002-01-05 16:54       ` Robert Love
  2002-01-05 12:42     ` Ingo Molnar
  1 sibling, 1 reply; 65+ messages in thread
From: george anzinger @ 2002-01-05  7:53 UTC (permalink / raw)
  To: Roger Larsson; +Cc: mingo, Dieter Nützel, Linux Kernel List

Roger Larsson wrote:
>
> On Fridayen den 4 January 2002 12.42, Ingo Molnar wrote:
> > On Fri, 4 Jan 2002, Dieter [iso-8859-15] Nützel wrote:
> > > What next? Maybe a combination of O(1) and preempt?
> >
> > yes, fast preemption of kernel-mode tasks and the scheduler code are
> > almost orthogonal. So i agree that to get the best interactive performance
> > we need both.
> >
> >       Ingo
> >
> > ps. i'm working on fixing the crashes you saw.
> >
> > -
> > To unsubscribe from this list: send the line "unsubscribe linux-kernel" in
> > the body of a message to majordomo@vger.kernel.org
> > More majordomo info at  http://vger.kernel.org/majordomo-info.html
> > Please read the FAQ at  http://www.tux.org/lkml/
>
> Ingo,
>
> The preemtion kernel adds protection to per process data...
> And it is not (yet) updated to handle the O(1) scheduler!

The two patches will are not compatable.  When the time comes we will
have to work out how to make them compatable as they both modify key
parts of sched.c.

George
>
> /RogerL
>
> --
> Roger Larsson
> Skellefteå
> Sweden
> -
> To unsubscribe from this list: send the line "unsubscribe linux-kernel" in
> the body of a message to majordomo@vger.kernel.org
> More majordomo info at  http://vger.kernel.org/majordomo-info.html
> Please read the FAQ at  http://www.tux.org/lkml/

--
George           george@mvista.com
High-res-timers: http://sourceforge.net/projects/high-res-timers/
Real time sched: http://sourceforge.net/projects/rtsched/

^ permalink raw reply	[flat|nested] 65+ messages in thread
* Re: [announce] [patch] ultra-scalable O(1) SMP and UP scheduler
  2002-01-05  0:28   ` Roger Larsson
  2002-01-05  7:53     ` george anzinger
@ 2002-01-05 12:42     ` Ingo Molnar
  1 sibling, 0 replies; 65+ messages in thread
From: Ingo Molnar @ 2002-01-05 12:42 UTC (permalink / raw)
  To: Roger Larsson; +Cc: Dieter Nützel, Linux Kernel List


On Sat, 5 Jan 2002, Roger Larsson wrote:

> The preemtion kernel adds protection to per process data... And it is
> not (yet) updated to handle the O(1) scheduler!

yes - what i meant was that there is no conceptual problem with having
both the preemption kernel and an O(1) scheduler. There are practical
problems though, because both change similar code areas, albeit for
different and orthogonal reasons.

	Ingo


^ permalink raw reply	[flat|nested] 65+ messages in thread
* Re: [announce] [patch] ultra-scalable O(1) SMP and UP scheduler
@ 2002-01-07 17:34 Rene Rebe
  0 siblings, 0 replies; 65+ messages in thread
From: Rene Rebe @ 2002-01-07 17:34 UTC (permalink / raw)
  To: Ingo Molnar; +Cc: linux-kernel

Hi all.

I tried the sched-O1-2.4.17-C1.patch on a 2.4.17 kernel running on a
UP Athlon-XP with 1466Mhz, 512MB RAM, SiS 735 board and an IBM IDE
disks.

I works (no crashes) including XFree-4.1 and ALSA modules loaded.

But during higher load (normal gcc compilations are enough) my system
gets really unresponsive and my mouse-cursor (USB-mouse, XFree-4.1,
Matrox G450) flickers with ~ 5fps over the screen ... :-((

I'll retry with the D0 patch ;-)

k33p h4ck1n6
  René Rebe

--
René Rebe (Registered Linux user: #248718 <http://counter.li.org>)

eMail:    rene.rebe@gmx.net
          rene@rocklinux.org

Homepage: http://www.tfh-berlin.de/~s712059/index.html

Anyone sending unwanted advertising e-mail to this address will be
charged $25 for network traffic and computing time. By extracting my
address from this message or its header, you agree to these terms.


^ permalink raw reply	[flat|nested] 65+ messages in thread
[parent not found: <20020107.191742.730580837.rene.rebe@gmx.net>]
end of thread, other threads:[~2002-01-07 19:53 UTC | newest]

Thread overview: 65+ messages (download: mbox.gz follow: Atom feed
-- links below jump to the message on this page --
2002-01-04  2:19 [announce] [patch] ultra-scalable O(1) SMP and UP scheduler Ingo Molnar
2002-01-04  4:27 ` Oliver Xymoron
2002-01-04  5:34 ` Ian Morgan
2002-01-04 10:30 ` Anton Blanchard
2002-01-04 12:53   ` Ingo Molnar
2002-01-04 14:18 ` Thomas Cataldo
2002-01-04 14:46 ` dan kelley
2002-01-04 17:07   ` Ingo Molnar
2002-01-04 15:22     ` Nikita Danilov
2002-01-05  4:33 ` Davide Libenzi
2002-01-05 20:24   ` Ingo Molnar
2002-01-05 19:49     ` Mika Liljeberg
2002-01-05 22:00       ` Ingo Molnar
2002-01-05 21:04         ` Mika Liljeberg
2002-01-05 23:04     ` Davide Libenzi
2002-01-05 23:41       ` Alan Cox
2002-01-05 23:46         ` Davide Libenzi
2002-01-06  0:47       ` Linus Torvalds
2002-01-06  2:57         ` Ingo Molnar
2002-01-06  1:27           ` Linus Torvalds
2002-01-06  1:45             ` Davide Libenzi
2002-01-06  3:55               ` Ingo Molnar
2002-01-06  2:16                 ` Davide Libenzi
2002-01-06  3:41             ` Ingo Molnar
2002-01-06  2:02               ` Davide Libenzi
2002-01-06  2:13                 ` Alan Cox
2002-01-06  2:12                   ` Davide Libenzi
2002-01-06  2:20                     ` Alan Cox
2002-01-06  2:17                       ` Davide Libenzi
2002-01-06  3:30                   ` 2.4.17 kernel without modules...was " Vikram
2002-01-06  4:07                   ` [announce] [patch] ultra-scalable O(1) " Ingo Molnar
2002-01-06  2:23                     ` Davide Libenzi
2002-01-06  2:30                     ` Alan Cox
2002-01-06  4:19                       ` Ingo Molnar
2002-01-07  3:08                   ` Richard Henderson
2002-01-07  3:16                     ` Linus Torvalds
2002-01-07  3:31                       ` Davide Libenzi
2002-01-07  3:34                         ` Linus Torvalds
2002-01-07  3:49                           ` Davide Libenzi
2002-01-06  4:01                 ` Ingo Molnar
2002-01-06  4:08               ` Ingo Molnar
2002-01-06  4:16                 ` Ingo Molnar
2002-01-06  3:55                   ` Luc Van Oostenryck
2002-01-07  8:00             ` Jens Axboe
2002-01-06  2:49       ` Ingo Molnar
2002-01-07  2:58 ` Rusty Russell
  -- strict thread matches above, loose matches on Subject: below --
2002-01-04  3:56 Ed Tomlinson
2002-01-04  7:42 Dieter Nützel
2002-01-04  8:02 ` David Lang
2002-01-04 11:44   ` Ingo Molnar
2002-01-04 11:33     ` David Lang
2002-01-04 13:39       ` Andrea Arcangeli
2002-01-04 14:04       ` Ingo Molnar
2002-01-04 13:36     ` Andrea Arcangeli
2002-01-04 15:44       ` Ingo Molnar
2002-01-04 14:45         ` Andrea Arcangeli
2002-01-04 11:16 rwhron
2002-01-04 13:20 ` Ingo Molnar
     [not found] <20020104074239.94E016DAA6@mail.elte.hu>
2002-01-04 11:42 ` Ingo Molnar
2002-01-05  0:28   ` Roger Larsson
2002-01-05  7:53     ` george anzinger
2002-01-05 16:54       ` Robert Love
2002-01-05 12:42     ` Ingo Molnar
2002-01-07 17:34 Rene Rebe
     [not found] <20020107.191742.730580837.rene.rebe@gmx.net>
     [not found] ` <Pine.LNX.4.33.0201072124380.14212-100000@localhost.localdomain>
2002-01-07 19:53   ` Rene Rebe
This is a public inbox, see mirroring instructions
for how to clone and mirror all data and code used for this inbox
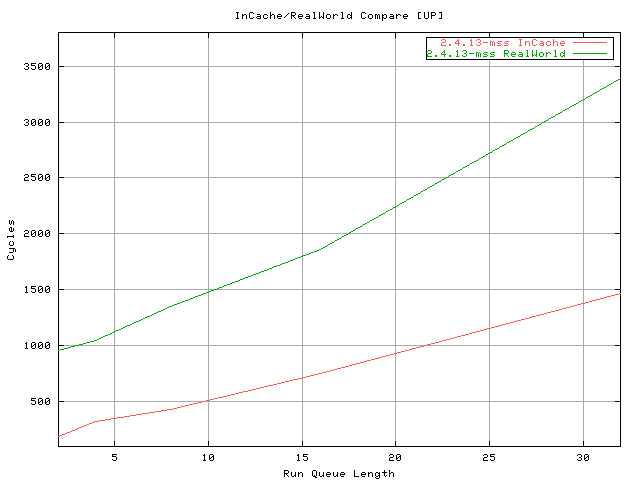
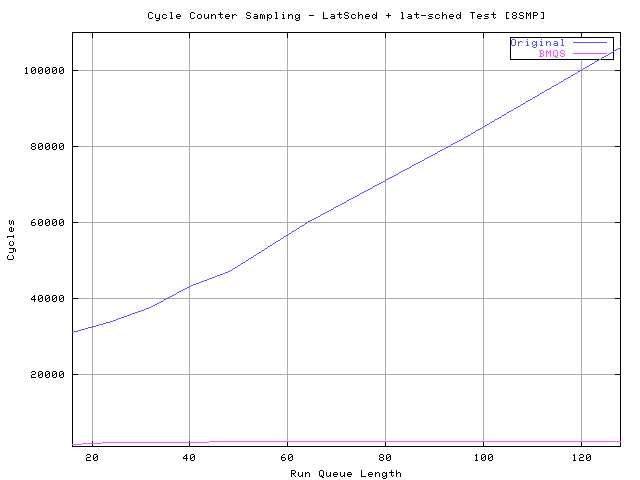