* [LTP] [PATCH v2] [RFC] pselect01: Tune thresholds
@ 2017-05-12 14:16 Cyril Hrubis
  2017-05-15 10:03 ` Jan Stancek
  0 siblings, 1 reply; 19+ messages in thread
From: Cyril Hrubis @ 2017-05-12 14:16 UTC (permalink / raw)
  To: ltp

The testcase was failing frequenty on virtual machines where the
thresholds were too tight and also on hardware without specialized timer
units so I've revisited the threshold computation and came with this
model:

The threshold per one syscall is computed as a sum of:

250 us                            - accomodates for context switches, etc.
2 * CLOCK_MONOTONIC resolution    - accomodates for granurality of the CLOCK_MONOTONIC
0.1% of the sleep capped on 100ms - which is slack allowed in kernel

Then it's multiplied by the number of iterations.

For hardware without specialized timer units (TSC, HPET and such) the threshold
is dominated by the CLOCK_MONOTONIC precision which is, depending on CONFIG_HZ,
something between 100ms and 10ms.

If hardware has high resolution timers, short sleeps are dominated by context
switches while longer sleeps are much more dominated by the slack.

And finally this all works only if the number of iterations is high enough, we
can still hit outliners otherwise so we add 1500us to the threshold to
compensate for them.

Signed-off-by: Cyril Hrubis <chrubis@suse.cz>
---
 testcases/kernel/syscalls/pselect/pselect01.c | 67 ++++++++++++++++++++++++---
 1 file changed, 60 insertions(+), 7 deletions(-)

diff --git a/testcases/kernel/syscalls/pselect/pselect01.c b/testcases/kernel/syscalls/pselect/pselect01.c
index 6f3b77b..4bb1261 100644
--- a/testcases/kernel/syscalls/pselect/pselect01.c
+++ b/testcases/kernel/syscalls/pselect/pselect01.c
@@ -41,14 +41,38 @@ struct tcase {
 	unsigned int iterations;
 };

+static unsigned int monotonic_resolution;
+
 static struct tcase tcases[] = {
-	{{1, 0},         1},
-	{{0, 1000000}, 100},
-	{{0, 2000000}, 100},
-	{{0, 10000000}, 10},
-	{{0, 100000000}, 1},
+	{{0, 1000000},  500},
+	{{0, 2000000},  500},
+	{{0, 10000000}, 300},
+	{{0, 100000000},  1},
+	{{1, 0},          1},
 };

+#define MIN(a, b) ((a) < (b) ? @ : (b))
+
+/*
+ * The threshold per one syscall is computed as a sum of:
+ *
+ *  250 us                 - accomodates for context switches, etc.
+ *  2*monotonic_resolution - accomodates for granurality of the CLOCK_MONOTONIC
+ *  slack_per_scall        - 0.1% of the sleep capped on 100ms
+ *                           which is slack allowed in kernel
+ *
+ * We also allow for outliners, i.e. add some number to the threshold in case
+ * that the number of iteration is small. For large enoung number of iterations
+ * outliners are averaged out.
+ */
+static int compute_threshold(long long requested_us, unsigned int iterations)
+{
+	unsigned int slack_per_scall = MIN(100000, requested_us / 1000);
+
+	return (250 + 2 * monotonic_resolution + slack_per_scall) * iterations
+		+ (iterations > 1 ? 0 : 1500);
+}
+
 static void verify_pselect(unsigned int n)
 {
 	fd_set readfds;
@@ -62,6 +86,8 @@ static void verify_pselect(unsigned int n)
 			t->tv.tv_sec, t->tv.tv_nsec, t->iterations);

 	for (i = 0; i < t->iterations; i++) {
+		long long elapsed_us;
+
 		FD_ZERO(&readfds);
 		FD_SET(0, &readfds);

@@ -71,11 +97,26 @@ static void verify_pselect(unsigned int n)
 		pselect(0, &readfds, NULL, NULL, &tv, NULL);
 		tst_timer_stop();

-		slept_us += tst_timer_elapsed_us();
+		elapsed_us = tst_timer_elapsed_us();
+
+		if (elapsed_us >= 10 * tst_timespec_to_us(t->tv)
+		    && elapsed_us > 3 * monotonic_resolution) {
+			tst_res(TINFO,
+				"Found outliner took %lli us, expected %lli us",
+				elapsed_us, tst_timespec_to_us(t->tv));
+		}
+
+		slept_us += elapsed_us;
 	}

 	requested_us = tst_timespec_to_us(t->tv) * t->iterations;
-	threshold = requested_us / 100 + 200 * t->iterations;
+	threshold = compute_threshold(tst_timespec_to_us(t->tv), t->iterations);
+
+	if (t->iterations > 1) {
+		tst_res(TINFO, "Mean sleep time %.2f us, expected %lli us, threshold %.2f",
+			1.00 * slept_us / t->iterations,
+			tst_timespec_to_us(t->tv), 1.00 * threshold / t->iterations);
+	}

 	if (slept_us < requested_us) {
 		tst_res(TFAIL,
@@ -95,8 +136,20 @@ static void verify_pselect(unsigned int n)
 		slept_us, requested_us, threshold);
 }

+static void setup(void)
+{
+	struct timespec t;
+
+	clock_getres(CLOCK_MONOTONIC, &t);
+
+	tst_res(TINFO, "CLOCK_MONOTONIC resolution %li ns", (long)t.tv_nsec);
+
+	monotonic_resolution = t.tv_nsec / 1000;
+}
+
 static struct tst_test test = {
 	.tid = "pselect01",
 	.test = verify_pselect,
+	.setup = setup,
 	.tcnt = ARRAY_SIZE(tcases),
 };
--
2.10.2


^ permalink raw reply related	[flat|nested] 19+ messages in thread
* [LTP] [PATCH v2] [RFC] pselect01: Tune thresholds
2017-05-12 14:16 [LTP] [PATCH v2] [RFC] pselect01: Tune thresholds Cyril Hrubis
@ 2017-05-15 10:03 ` Jan Stancek
2017-05-15 10:20 ` Xiao Yang
2017-05-15 12:36 ` Cyril Hrubis
0 siblings, 2 replies; 19+ messages in thread
From: Jan Stancek @ 2017-05-15 10:03 UTC (permalink / raw)
To: ltp
----- Original Message -----
> +
> +/*
> + * The threshold per one syscall is computed as a sum of:
> + *
> + * 250 us - accomodates for context switches, etc.
> + * 2*monotonic_resolution - accomodates for granurality of the
> CLOCK_MONOTONIC
> + * slack_per_scall - 0.1% of the sleep capped on 100ms
> + * which is slack allowed in kernel
> + *
> + * We also allow for outliners, i.e. add some number to the threshold in
> case
> + * that the number of iteration is small. For large enoung number of
> iterations
> + * outliners are averaged out.
> + */
> +static int compute_threshold(long long requested_us, unsigned int
> iterations)
> +{
> + unsigned int slack_per_scall = MIN(100000, requested_us / 1000);
Hi,
while looking at fs/select.c I noticed that it also takes
current->timer_slack_ns into account and uses that if
slack is smaller. Would it make sense to add ...?
slack_per_scall = MAX(slack_per_scall, prctl(PR_GET_TIMERSLACK) / 1000);
The default is 50us, so maybe the 250us in formula covers this already?
v2 looks good to me, and my KVM guest ran test successfully for hours.
Regards,
Jan
> +
> + return (250 + 2 * monotonic_resolution + slack_per_scall) * iterations
> + + (iterations > 1 ? 0 : 1500);
> +}
> +
^ permalink raw reply [flat|nested] 19+ messages in thread* [LTP] [PATCH v2] [RFC] pselect01: Tune thresholds
2017-05-15 10:03 ` Jan Stancek
@ 2017-05-15 10:20 ` Xiao Yang
2017-05-15 13:15 ` Jan Stancek
2017-05-15 12:36 ` Cyril Hrubis
1 sibling, 1 reply; 19+ messages in thread
From: Xiao Yang @ 2017-05-15 10:20 UTC (permalink / raw)
To: ltp
On 2017/05/15 18:03, Jan Stancek wrote:
>
> ----- Original Message -----
>> +
>> +/*
>> + * The threshold per one syscall is computed as a sum of:
>> + *
>> + * 250 us - accomodates for context switches, etc.
>> + * 2*monotonic_resolution - accomodates for granurality of the
>> CLOCK_MONOTONIC
>> + * slack_per_scall - 0.1% of the sleep capped on 100ms
>> + * which is slack allowed in kernel
>> + *
>> + * We also allow for outliners, i.e. add some number to the threshold in
>> case
>> + * that the number of iteration is small. For large enoung number of
>> iterations
>> + * outliners are averaged out.
>> + */
>> +static int compute_threshold(long long requested_us, unsigned int
>> iterations)
>> +{
>> + unsigned int slack_per_scall = MIN(100000, requested_us / 1000);
> Hi,
>
> while looking at fs/select.c I noticed that it also takes
> current->timer_slack_ns into account and uses that if
> slack is smaller. Would it make sense to add ...?
> slack_per_scall = MAX(slack_per_scall, prctl(PR_GET_TIMERSLACK) / 1000);
> The default is 50us, so maybe the 250us in formula covers this already?
>
> v2 looks good to me, and my KVM guest ran test successfully for hours.
>
> Regards,
> Jan
Hi Jan and Cyril,
Did you get the following error message when running pselect01 on
RHEL5.11GA (physical machine):
=====================================================================================
[root@RHEL5U11ga_Intel64 pselect]# ./pselect01
tst_test.c:847: INFO: Timeout per run is 0h 05m 00s
pselect01.c:62: INFO: pselect() sleeping for 1 secs 0 nsec 1 iterations
pselect01.c:95: PASS: pselect() slept for 1000443us, requested
1000000us, treshold 10200
pselect01.c:62: INFO: pselect() sleeping for 0 secs 1000000 nsec 100
iterations
pselect01.c:95: PASS: pselect() slept for 101455us, requested 100000us,
treshold 21000
pselect01.c:62: INFO: pselect() sleeping for 0 secs 2000000 nsec 100
iterations
pselect01.c:95: PASS: pselect() slept for 203069us, requested 200000us,
treshold 22000
pselect01.c:62: INFO: pselect() sleeping for 0 secs 10000000 nsec 10
iterations
pselect01.c:83: FAIL: pselect() woken up too early 99536us, expected
100000us
pselect01.c:62: INFO: pselect() sleeping for 0 secs 100000000 nsec 1
iterations
pselect01.c:95: PASS: pselect() slept for 100559us, requested 100000us,
treshold 1200
=====================================================================================
It seems that pselect woke up early on RHEL5.11GA.
Thanks
Xiao Yang.
>> +
>> + return (250 + 2 * monotonic_resolution + slack_per_scall) * iterations
>> + + (iterations> 1 ? 0 : 1500);
>> +}
>> +
^ permalink raw reply [flat|nested] 19+ messages in thread* [LTP] [PATCH v2] [RFC] pselect01: Tune thresholds
2017-05-15 10:20 ` Xiao Yang
@ 2017-05-15 13:15 ` Jan Stancek
2017-05-15 13:23 ` Cyril Hrubis
0 siblings, 1 reply; 19+ messages in thread
From: Jan Stancek @ 2017-05-15 13:15 UTC (permalink / raw)
To: ltp
----- Original Message -----
> Hi Jan and Cyril,
>
> Did you get the following error message when running pselect01 on
> RHEL5.11GA (physical machine):
> =====================================================================================
> [root@RHEL5U11ga_Intel64 pselect]# ./pselect01
> tst_test.c:847: INFO: Timeout per run is 0h 05m 00s
> pselect01.c:62: INFO: pselect() sleeping for 1 secs 0 nsec 1 iterations
> pselect01.c:95: PASS: pselect() slept for 1000443us, requested
> 1000000us, treshold 10200
> pselect01.c:62: INFO: pselect() sleeping for 0 secs 1000000 nsec 100
> iterations
> pselect01.c:95: PASS: pselect() slept for 101455us, requested 100000us,
> treshold 21000
> pselect01.c:62: INFO: pselect() sleeping for 0 secs 2000000 nsec 100
> iterations
> pselect01.c:95: PASS: pselect() slept for 203069us, requested 200000us,
> treshold 22000
> pselect01.c:62: INFO: pselect() sleeping for 0 secs 10000000 nsec 10
> iterations
> pselect01.c:83: FAIL: pselect() woken up too early 99536us, expected
> 100000us
> pselect01.c:62: INFO: pselect() sleeping for 0 secs 100000000 nsec 1
> iterations
> pselect01.c:95: PASS: pselect() slept for 100559us, requested 100000us,
> treshold 1200
> =====================================================================================
>
> It seems that pselect woke up early on RHEL5.11GA.
Yes, I see that too. It fails pretty often, even on KVM guest.
pselect6(0, [], NULL, NULL, {0, 2000000}, {NULL, 8}) = 0 (Timeout) <0.001822>
pselect6(0, [], NULL, NULL, {0, 10000000}, {NULL, 8}) = 0 (Timeout) <0.009775>
pselect6(0, [], NULL, NULL, {0, 100000000}, {NULL, 8}) = 0 (Timeout) <0.099808>
^ permalink raw reply [flat|nested] 19+ messages in thread* [LTP] [PATCH v2] [RFC] pselect01: Tune thresholds
2017-05-15 13:15 ` Jan Stancek
@ 2017-05-15 13:23 ` Cyril Hrubis
0 siblings, 0 replies; 19+ messages in thread
From: Cyril Hrubis @ 2017-05-15 13:23 UTC (permalink / raw)
To: ltp
Hi!
> > It seems that pselect woke up early on RHEL5.11GA.
>
> Yes, I see that too. It fails pretty often, even on KVM guest.
>
> pselect6(0, [], NULL, NULL, {0, 2000000}, {NULL, 8}) = 0 (Timeout) <0.001822>
> pselect6(0, [], NULL, NULL, {0, 10000000}, {NULL, 8}) = 0 (Timeout) <0.009775>
> pselect6(0, [], NULL, NULL, {0, 100000000}, {NULL, 8}) = 0 (Timeout) <0.099808>
Looks like a bug to me, the timers are not allowed to wake up sooner.
--
Cyril Hrubis
chrubis@suse.cz
^ permalink raw reply [flat|nested] 19+ messages in thread
* [LTP] [PATCH v2] [RFC] pselect01: Tune thresholds
  2017-05-15 10:03 ` Jan Stancek
  2017-05-15 10:20   ` Xiao Yang
@ 2017-05-15 12:36   ` Cyril Hrubis
  2017-05-15 13:00     ` Jan Stancek
  1 sibling, 1 reply; 19+ messages in thread
From: Cyril Hrubis @ 2017-05-15 12:36 UTC (permalink / raw)
  To: ltp

Hi!
> while looking at fs/select.c I noticed that it also takes
> current->timer_slack_ns into account and uses that if
> slack is smaller. Would it make sense to add ...?
>   slack_per_scall = MAX(slack_per_scall, prctl(PR_GET_TIMERSLACK) / 1000);
> The default is 50us, so maybe the 250us in formula covers this already?

I guess that the 50us is included in the 250us already. So what about
adding the line you sugests and decreasing the 250us to 200us?

--
Cyril Hrubis
chrubis@suse.cz

^ permalink raw reply	[flat|nested] 19+ messages in thread
* [LTP] [PATCH v2] [RFC] pselect01: Tune thresholds
  2017-05-15 12:36   ` Cyril Hrubis
@ 2017-05-15 13:00     ` Jan Stancek
  2017-05-15 13:13       ` Cyril Hrubis
  0 siblings, 1 reply; 19+ messages in thread
From: Jan Stancek @ 2017-05-15 13:00 UTC (permalink / raw)
  To: ltp


----- Original Message -----
> Hi!
> > while looking at fs/select.c I noticed that it also takes
> > current->timer_slack_ns into account and uses that if
> > slack is smaller. Would it make sense to add ...?
> >   slack_per_scall = MAX(slack_per_scall, prctl(PR_GET_TIMERSLACK) / 1000);
> > The default is 50us, so maybe the 250us in formula covers this already?
>
> I guess that the 50us is included in the 250us already. So what about
> adding the line you sugests and decreasing the 250us to 200us?

We can do that, but looking again at  PR_GET_TIMERSLACK, it is supported
since 2.6.28, so we'd need to skip older kernels or fall back to a
default of 50us.

Regards,
Jan

^ permalink raw reply	[flat|nested] 19+ messages in thread
* [LTP] [PATCH v2] [RFC] pselect01: Tune thresholds
  2017-05-15 13:00     ` Jan Stancek
@ 2017-05-15 13:13       ` Cyril Hrubis
  2017-05-15 13:16         ` Jan Stancek
  2017-05-22  8:39         ` Jan Stancek
  0 siblings, 2 replies; 19+ messages in thread
From: Cyril Hrubis @ 2017-05-15 13:13 UTC (permalink / raw)
  To: ltp

Hi!
> > I guess that the 50us is included in the 250us already. So what about
> > adding the line you sugests and decreasing the 250us to 200us?
>
> We can do that, but looking again at  PR_GET_TIMERSLACK, it is supported
> since 2.6.28, so we'd need to skip older kernels or fall back to a
> default of 50us.

Let's sort that out after the release, I will commit v2 as it is, ok?

--
Cyril Hrubis
chrubis@suse.cz

^ permalink raw reply	[flat|nested] 19+ messages in thread
* [LTP] [PATCH v2] [RFC] pselect01: Tune thresholds
  2017-05-15 13:13       ` Cyril Hrubis
@ 2017-05-15 13:16         ` Jan Stancek
  2017-05-22  8:39         ` Jan Stancek
  1 sibling, 0 replies; 19+ messages in thread
From: Jan Stancek @ 2017-05-15 13:16 UTC (permalink / raw)
  To: ltp


----- Original Message -----
> Hi!
> > > I guess that the 50us is included in the 250us already. So what about
> > > adding the line you sugests and decreasing the 250us to 200us?
> >
> > We can do that, but looking again at  PR_GET_TIMERSLACK, it is supported
> > since 2.6.28, so we'd need to skip older kernels or fall back to a
> > default of 50us.
>
> Let's sort that out after the release, I will commit v2 as it is, ok?

ACK

Regards,
Jan

^ permalink raw reply	[flat|nested] 19+ messages in thread
* [LTP] [PATCH v2] [RFC] pselect01: Tune thresholds
  2017-05-15 13:13       ` Cyril Hrubis
  2017-05-15 13:16         ` Jan Stancek
@ 2017-05-22  8:39         ` Jan Stancek
  2017-05-22 12:04           ` Cyril Hrubis
  2017-05-22 13:19           ` Cyril Hrubis
  1 sibling, 2 replies; 19+ messages in thread
From: Jan Stancek @ 2017-05-22  8:39 UTC (permalink / raw)
  To: ltp


----- Original Message -----
> Hi!
> > > I guess that the 50us is included in the 250us already. So what about
> > > adding the line you sugests and decreasing the 250us to 200us?
> >
> > We can do that, but looking again at  PR_GET_TIMERSLACK, it is supported
> > since 2.6.28, so we'd need to skip older kernels or fall back to a
> > default of 50us.
>
> Let's sort that out after the release, I will commit v2 as it is, ok?

I'm seeing this test failing a lot now on RHEL6/7 as some cases are
now more strict.

ppc KVM guest
pselect01.c:131: FAIL: pselect() slept for too long 1006090us, expected 1000000us, threshold 2750

slow x86 bare metal system
pselect01.c:145: INFO: CLOCK_MONOTONIC resolution 1 ns
pselect01.c:86: INFO: pselect() sleeping for 0 secs 1000000 nsec 500 iterations
pselect01.c:118: INFO: Mean sleep time 1237.06 us, expected 1000 us, threshold 251.00
pselect01.c:136: PASS: pselect() slept for 618532us, requested 500000us, treshold 125500
pselect01.c:86: INFO: pselect() sleeping for 0 secs 2000000 nsec 500 iterations
pselect01.c:118: INFO: Mean sleep time 2610.75 us, expected 2000 us, threshold 252.00
pselect01.c:131: FAIL: pselect() slept for too long 1305373us, expected 1000000us, threshold 126000
pselect01.c:86: INFO: pselect() sleeping for 0 secs 10000000 nsec 300 iterations
pselect01.c:118: INFO: Mean sleep time 10590.66 us, expected 10000 us, threshold 260.00
pselect01.c:131: FAIL: pselect() slept for too long 3177198us, expected 3000000us, threshold 78000
pselect01.c:86: INFO: pselect() sleeping for 0 secs 100000000 nsec 1 iterations
pselect01.c:136: PASS: pselect() slept for 100670us, requested 100000us, treshold 1850
pselect01.c:86: INFO: pselect() sleeping for 1 secs 0 nsec 1 iterations
pselect01.c:136: PASS: pselect() slept for 1001063us, requested 1000000us, treshold 2750

x86 kvm guest
pselect01.c:145: INFO: CLOCK_MONOTONIC resolution 1 ns
pselect01.c:86: INFO: pselect() sleeping for 0 secs 1000000 nsec 500 iterations
pselect01.c:118: INFO: Mean sleep time 1251.76 us, expected 1000 us, threshold 251.00
pselect01.c:131: FAIL: pselect() slept for too long 625882us, expected 500000us, threshold 125500
pselect01.c:86: INFO: pselect() sleeping for 0 secs 2000000 nsec 500 iterations
pselect01.c:118: INFO: Mean sleep time 2256.17 us, expected 2000 us, threshold 252.00
pselect01.c:131: FAIL: pselect() slept for too long 1128083us, expected 1000000us, threshold 126000
pselect01.c:86: INFO: pselect() sleeping for 0 secs 10000000 nsec 300 iterations
pselect01.c:118: INFO: Mean sleep time 10257.38 us, expected 10000 us, threshold 260.00
pselect01.c:136: PASS: pselect() slept for 3077214us, requested 3000000us, treshold 78000
pselect01.c:86: INFO: pselect() sleeping for 0 secs 100000000 nsec 1 iterations
pselect01.c:136: PASS: pselect() slept for 100283us, requested 100000us, treshold 1850
pselect01.c:86: INFO: pselect() sleeping for 1 secs 0 nsec 1 iterations
pselect01.c:136: PASS: pselect() slept for 1001068us, requested 1000000us, treshold 2750

Regards,
Jan

^ permalink raw reply	[flat|nested] 19+ messages in thread
* [LTP] [PATCH v2] [RFC] pselect01: Tune thresholds
  2017-05-22  8:39         ` Jan Stancek
@ 2017-05-22 12:04           ` Cyril Hrubis
  2017-05-22 13:37             ` Jan Stancek
  2017-05-22 13:19           ` Cyril Hrubis
  1 sibling, 1 reply; 19+ messages in thread
From: Cyril Hrubis @ 2017-05-22 12:04 UTC (permalink / raw)
  To: ltp

Hi!
> I'm seeing this test failing a lot now on RHEL6/7 as some cases are
> now more strict.
>
> ppc KVM guest
> pselect01.c:131: FAIL: pselect() slept for too long 1006090us, expected 1000000us, threshold 2750
>
> slow x86 bare metal system
> pselect01.c:145: INFO: CLOCK_MONOTONIC resolution 1 ns
> pselect01.c:86: INFO: pselect() sleeping for 0 secs 1000000 nsec 500 iterations
> pselect01.c:118: INFO: Mean sleep time 1237.06 us, expected 1000 us, threshold 251.00
> pselect01.c:136: PASS: pselect() slept for 618532us, requested 500000us, treshold 125500
> pselect01.c:86: INFO: pselect() sleeping for 0 secs 2000000 nsec 500 iterations
> pselect01.c:118: INFO: Mean sleep time 2610.75 us, expected 2000 us, threshold 252.00
> pselect01.c:131: FAIL: pselect() slept for too long 1305373us, expected 1000000us, threshold 126000
> pselect01.c:86: INFO: pselect() sleeping for 0 secs 10000000 nsec 300 iterations
> pselect01.c:118: INFO: Mean sleep time 10590.66 us, expected 10000 us, threshold 260.00
> pselect01.c:131: FAIL: pselect() slept for too long 3177198us, expected 3000000us, threshold 78000

What kind of a system is that (hardware/kernel)?

Have you tried that measure.c program I've send you there as well?

Maybe we should just try to discard something as 5% of the outliners as
well. I.e. storing the measured times in an array, sort it and discard
some of the measurements.

> pselect01.c:86: INFO: pselect() sleeping for 0 secs 100000000 nsec 1 iterations
> pselect01.c:136: PASS: pselect() slept for 100670us, requested 100000us, treshold 1850
> pselect01.c:86: INFO: pselect() sleeping for 1 secs 0 nsec 1 iterations
> pselect01.c:136: PASS: pselect() slept for 1001063us, requested 1000000us, treshold 2750
>
> x86 kvm guest
> pselect01.c:145: INFO: CLOCK_MONOTONIC resolution 1 ns
> pselect01.c:86: INFO: pselect() sleeping for 0 secs 1000000 nsec 500 iterations
> pselect01.c:118: INFO: Mean sleep time 1251.76 us, expected 1000 us, threshold 251.00
> pselect01.c:131: FAIL: pselect() slept for too long 625882us, expected 500000us, threshold 125500
> pselect01.c:86: INFO: pselect() sleeping for 0 secs 2000000 nsec 500 iterations
> pselect01.c:118: INFO: Mean sleep time 2256.17 us, expected 2000 us, threshold 252.00
> pselect01.c:131: FAIL: pselect() slept for too long 1128083us, expected 1000000us, threshold 126000
> pselect01.c:86: INFO: pselect() sleeping for 0 secs 10000000 nsec 300 iterations
> pselect01.c:118: INFO: Mean sleep time 10257.38 us, expected 10000 us, threshold 260.00
> pselect01.c:136: PASS: pselect() slept for 3077214us, requested 3000000us, treshold 78000
> pselect01.c:86: INFO: pselect() sleeping for 0 secs 100000000 nsec 1 iterations
> pselect01.c:136: PASS: pselect() slept for 100283us, requested 100000us, treshold 1850
> pselect01.c:86: INFO: pselect() sleeping for 1 secs 0 nsec 1 iterations
> pselect01.c:136: PASS: pselect() slept for 1001068us, requested 1000000us, treshold 2750

These are failing just by a small bit, does the test work fine there if
you increase the static part of the threshold by 50?

--
Cyril Hrubis
chrubis@suse.cz

^ permalink raw reply	[flat|nested] 19+ messages in thread
* [LTP] [PATCH v2] [RFC] pselect01: Tune thresholds
  2017-05-22 12:04           ` Cyril Hrubis
@ 2017-05-22 13:37             ` Jan Stancek
  0 siblings, 0 replies; 19+ messages in thread
From: Jan Stancek @ 2017-05-22 13:37 UTC (permalink / raw)
  To: ltp


----- Original Message -----
> Hi!
> > I'm seeing this test failing a lot now on RHEL6/7 as some cases are
> > now more strict.
>
> What kind of a system is that (hardware/kernel)?

Moonshot M700, AMD Opteron(tm) X2150 APU, 3000.21 BogoMIPS
RHEL7.4 3.10.0-666.el7 and upstream 4.11

> Have you tried that measure.c program I've send you there as well?

3.10.0-666.el7
./measure
min 119 max 167 median 161 mean 160.91 0.1% 0.10
min 560 max 1149 median 567 mean 793.39 0.1% 0.50
min 1062 max 1668 median 1068 mean 1237.44 0.1% 1.00
min 2077 max 2679 median 2623 mean 2582.46 0.1% 2.00
min 3045 max 3758 median 3624 mean 3587.18 0.1% 3.00
min 4092 max 4687 median 4624 mean 4597.38 0.1% 4.00
min 10072 max 10705 median 10624 mean 10596.56 0.1% 10.00
min 100125 max 100796 median 100676 mean 100631.29 0.1% 100.00
min 500149 max 501168 median 501077 mean 501017.30 0.1% 500.00
min 1000341 max 1001713 median 1001578 mean 1001553.56 0.1% 1000.00

4.11
./measure
min 154 max 168 median 160 mean 160.41 0.1% 0.10
min 560 max 1180 median 568 mean 776.71 0.1% 0.50
min 1061 max 1718 median 1069 mean 1283.03 0.1% 1.00
min 2071 max 2706 median 2625 mean 2574.26 0.1% 2.00
min 3083 max 3738 median 3625 mean 3583.02 0.1% 3.00
min 4110 max 4719 median 4626 mean 4584.89 0.1% 4.00
min 10077 max 10768 median 10629 mean 10526.83 0.1% 10.00
min 100127 max 100780 median 100684 mean 100611.68 0.1% 100.00
min 500385 max 501144 median 501019 mean 500861.94 0.1% 500.00
min 1000239 max 1001655 median 1001580 mean 1001460.26 0.1% 1000.00

>
> Maybe we should just try to discard something as 5% of the outliners as
> well. I.e. storing the measured times in an array, sort it and discard
> some of the measurements.

Based on output from measure.c it looks most values have very similar
offset - it's just slightly larger on this system.

I tried to discard 10%, but I'll re-run it with your v2 measure
program.

>
> These are failing just by a small bit, does the test work fine there if
> you increase the static part of the threshold by 50?

I'm trying on moonshot system now, and I need to go as high as + ~350
to make it pass.

Regards,
Jan

^ permalink raw reply	[flat|nested] 19+ messages in thread
* [LTP] [PATCH v2] [RFC] pselect01: Tune thresholds
  2017-05-22  8:39         ` Jan Stancek
  2017-05-22 12:04           ` Cyril Hrubis
@ 2017-05-22 13:19           ` Cyril Hrubis
  2017-05-22 14:57             ` Jan Stancek
  1 sibling, 1 reply; 19+ messages in thread
From: Cyril Hrubis @ 2017-05-22 13:19 UTC (permalink / raw)
  To: ltp

Hi!
New measure script attached, now with gnuplot frequency graphs.

Can you, pretty please run that on the slow x86 machine, so that we know
if the failure is caused by a few outliners of if the measured times are
simply skeewed there?

--
Cyril Hrubis
chrubis@suse.cz
-------------- next part --------------
A non-text attachment was scrubbed...
Name: measure.tar.bz2
Type: application/x-bzip2
Size: 43932 bytes
Desc: not available
URL: <http://lists.linux.it/pipermail/ltp/attachments/20170522/73c94c94/attachment-0001.bin>

^ permalink raw reply	[flat|nested] 19+ messages in thread
* [LTP] [PATCH v2] [RFC] pselect01: Tune thresholds
  2017-05-22 13:19           ` Cyril Hrubis
@ 2017-05-22 14:57             ` Jan Stancek
  2017-05-22 15:15               ` Cyril Hrubis
  0 siblings, 1 reply; 19+ messages in thread
From: Jan Stancek @ 2017-05-22 14:57 UTC (permalink / raw)
  To: ltp


----- Original Message -----
> Hi!
> New measure script attached, now with gnuplot frequency graphs.
>
> Can you, pretty please run that on the slow x86 machine, so that we know
> if the failure is caused by a few outliners of if the measured times are
> simply skeewed there?

Attached.

Regards,
Jan
-------------- next part --------------
A non-text attachment was scrubbed...
Name: measure_moonshot.tar.bz2
Type: application/x-bzip-compressed-tar
Size: 10376 bytes
Desc: not available
URL: <http://lists.linux.it/pipermail/ltp/attachments/20170522/859c9566/attachment.bin>

^ permalink raw reply	[flat|nested] 19+ messages in thread
* [LTP] [PATCH v2] [RFC] pselect01: Tune thresholds
  2017-05-22 14:57             ` Jan Stancek
@ 2017-05-22 15:15               ` Cyril Hrubis
  2017-05-23  7:54                 ` Jan Stancek
  0 siblings, 1 reply; 19+ messages in thread
From: Cyril Hrubis @ 2017-05-22 15:15 UTC (permalink / raw)
  To: ltp

Hi!
> > New measure script attached, now with gnuplot frequency graphs.
> >
> > Can you, pretty please run that on the slow x86 machine, so that we know
> > if the failure is caused by a few outliners of if the measured times are
> > simply skeewed there?
>
> Attached.

Hmm, strange, it looks like for 100us we got more or less all samples
close to 160us but for 500us half of the samples are close to 560us and
about 400 is more than 1000us, that does not look right. I wonder what
happens there. And the same for the rest of the measurements everything
but 100us sleeps has two peaks that are more or less 500us apart. So far
my machines, even VMs, had one peak and some outliners.

Can you try to rerun the test with a realtime priority?

--
Cyril Hrubis
chrubis@suse.cz

^ permalink raw reply	[flat|nested] 19+ messages in thread
* [LTP] [PATCH v2] [RFC] pselect01: Tune thresholds
  2017-05-22 15:15               ` Cyril Hrubis
@ 2017-05-23  7:54                 ` Jan Stancek
  2017-05-23  9:16                   ` Cyril Hrubis
  0 siblings, 1 reply; 19+ messages in thread
From: Jan Stancek @ 2017-05-23  7:54 UTC (permalink / raw)
  To: ltp


----- Original Message -----
> Hi!
> > > New measure script attached, now with gnuplot frequency graphs.
> > >
> > > Can you, pretty please run that on the slow x86 machine, so that we know
> > > if the failure is caused by a few outliners of if the measured times are
> > > simply skeewed there?
> >
> > Attached.
>
> Hmm, strange, it looks like for 100us we got more or less all samples
> close to 160us but for 500us half of the samples are close to 560us and
> about 400 is more than 1000us, that does not look right. I wonder what
> happens there. And the same for the rest of the measurements everything
> but 100us sleeps has two peaks that are more or less 500us apart. So far
> my machines, even VMs, had one peak and some outliners.
>
> Can you try to rerun the test with a realtime priority?

Ran as "chrt -f 50 ./measure", results attached.

-------------- next part --------------
A non-text attachment was scrubbed...
Name: measure_moonshot_rt.tar.bz2
Type: application/x-bzip-compressed-tar
Size: 10590 bytes
Desc: not available
URL: <http://lists.linux.it/pipermail/ltp/attachments/20170523/af1d22d2/attachment.bin>

^ permalink raw reply	[flat|nested] 19+ messages in thread
* [LTP] [PATCH v2] [RFC] pselect01: Tune thresholds
  2017-05-23  7:54                 ` Jan Stancek
@ 2017-05-23  9:16                   ` Cyril Hrubis
  2017-05-23  9:45                     ` Jan Stancek
  0 siblings, 1 reply; 19+ messages in thread
From: Cyril Hrubis @ 2017-05-23  9:16 UTC (permalink / raw)
  To: ltp

Hi!
> > Hmm, strange, it looks like for 100us we got more or less all samples
> > close to 160us but for 500us half of the samples are close to 560us and
> > about 400 is more than 1000us, that does not look right. I wonder what
> > happens there. And the same for the rest of the measurements everything
> > but 100us sleeps has two peaks that are more or less 500us apart. So far
> > my machines, even VMs, had one peak and some outliners.
> >
> > Can you try to rerun the test with a realtime priority?
>
> Ran as "chrt -f 50 ./measure", results attached.
>

Looks more or less the same and I still cannot reproduce the issue on
any of the machines I have here.

Looking at errata for AMD cpus #778 says that TSC may drift under some
circumstances:
http://support.amd.com/TechDocs/51810_16h_00h-0Fh_Rev_Guide.pdf#unique_29

Can you try to disable P-state in BIOS or set cpufreq to performance?

--
Cyril Hrubis
chrubis@suse.cz

^ permalink raw reply	[flat|nested] 19+ messages in thread
* [LTP] [PATCH v2] [RFC] pselect01: Tune thresholds
  2017-05-23  9:16                   ` Cyril Hrubis
@ 2017-05-23  9:45                     ` Jan Stancek
  2017-06-02 12:48                       ` Jan Stancek
  0 siblings, 1 reply; 19+ messages in thread
From: Jan Stancek @ 2017-05-23  9:45 UTC (permalink / raw)
  To: ltp


----- Original Message -----
> Hi!
> > > Hmm, strange, it looks like for 100us we got more or less all samples
> > > close to 160us but for 500us half of the samples are close to 560us and
> > > about 400 is more than 1000us, that does not look right. I wonder what
> > > happens there. And the same for the rest of the measurements everything
> > > but 100us sleeps has two peaks that are more or less 500us apart. So far
> > > my machines, even VMs, had one peak and some outliners.
> > >
> > > Can you try to rerun the test with a realtime priority?
> >
> > Ran as "chrt -f 50 ./measure", results attached.
> >
>
> Looks more or less the same and I still cannot reproduce the issue on
> any of the machines I have here.
>
> Looking at errata for AMD cpus #778 says that TSC may drift under some
> circumstances:
> http://support.amd.com/TechDocs/51810_16h_00h-0Fh_Rev_Guide.pdf#unique_29
>
> Can you try to disable P-state in BIOS or set cpufreq to performance?

Not sure if I can get easily to BIOS, it's a system in remote location.
As for cpufreq, it already was set to performance:

# cat /sys/devices/system/cpu/cpufreq/policy*/scaling_governor
performance
performance
performance
performance

Regards,
Jan

^ permalink raw reply	[flat|nested] 19+ messages in thread
* [LTP] [PATCH v2] [RFC] pselect01: Tune thresholds
2017-05-23 9:45 ` Jan Stancek
@ 2017-06-02 12:48 ` Jan Stancek
0 siblings, 0 replies; 19+ messages in thread
From: Jan Stancek @ 2017-06-02 12:48 UTC (permalink / raw)
To: ltp
----- Original Message -----
>
> > > > Can you try to rerun the test with a realtime priority?
> > >
> > > Ran as "chrt -f 50 ./measure", results attached.
> > >
> >
> > Looks more or less the same and I still cannot reproduce the issue on
> > any of the machines I have here.
> >
> > Looking at errata for AMD cpus #778 says that TSC may drift under some
> > circumstances:
> > http://support.amd.com/TechDocs/51810_16h_00h-0Fh_Rev_Guide.pdf#unique_29
> >
> > Can you try to disable P-state in BIOS or set cpufreq to performance?
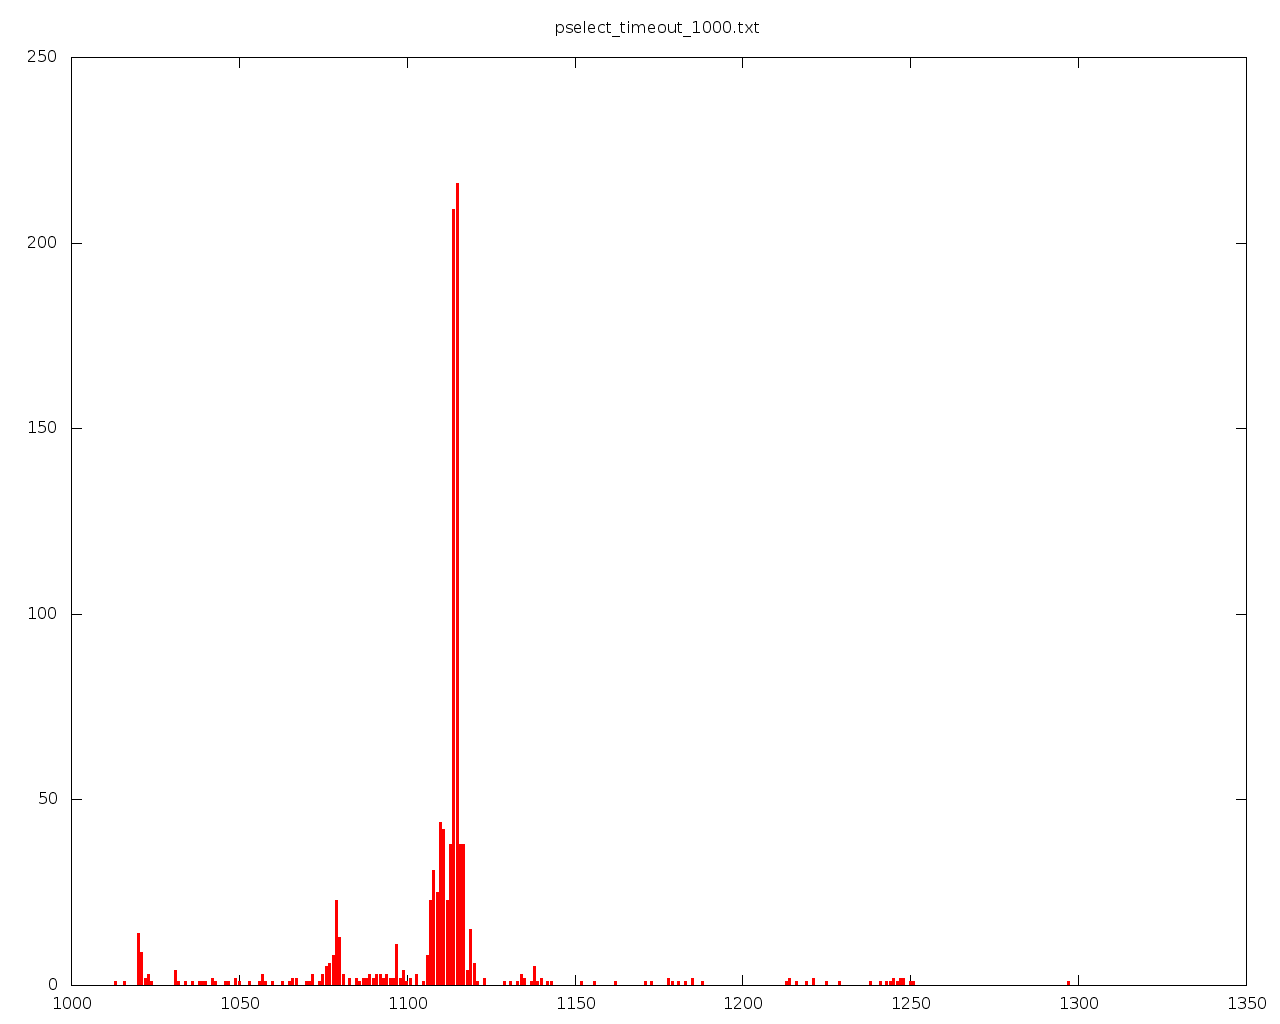
I've been running more numbers on different system. This one is pretty
beefy: IBM System x3950 X5 7145, 128 CPUs, 8 nodes. Kernel 4.11.3.
vendor_id : GenuineIntel
cpu family : 6
model : 46
model name : Intel(R) Xeon(R) CPU X7560 @ 2.27GHz
With performance, default priority and MONOTONIC_RAW, it's getting very
closely to threshold, rarely failing pselect01 test.
My guess is it's because process gets migrated/woken up on
random CPUs. Attached is (pselect_timeout_1000.png) from your measure program.
Running it with FIFO scheduling shaves off ~50us on average.
What also helps is to pin it to CPU 0, that shaves off
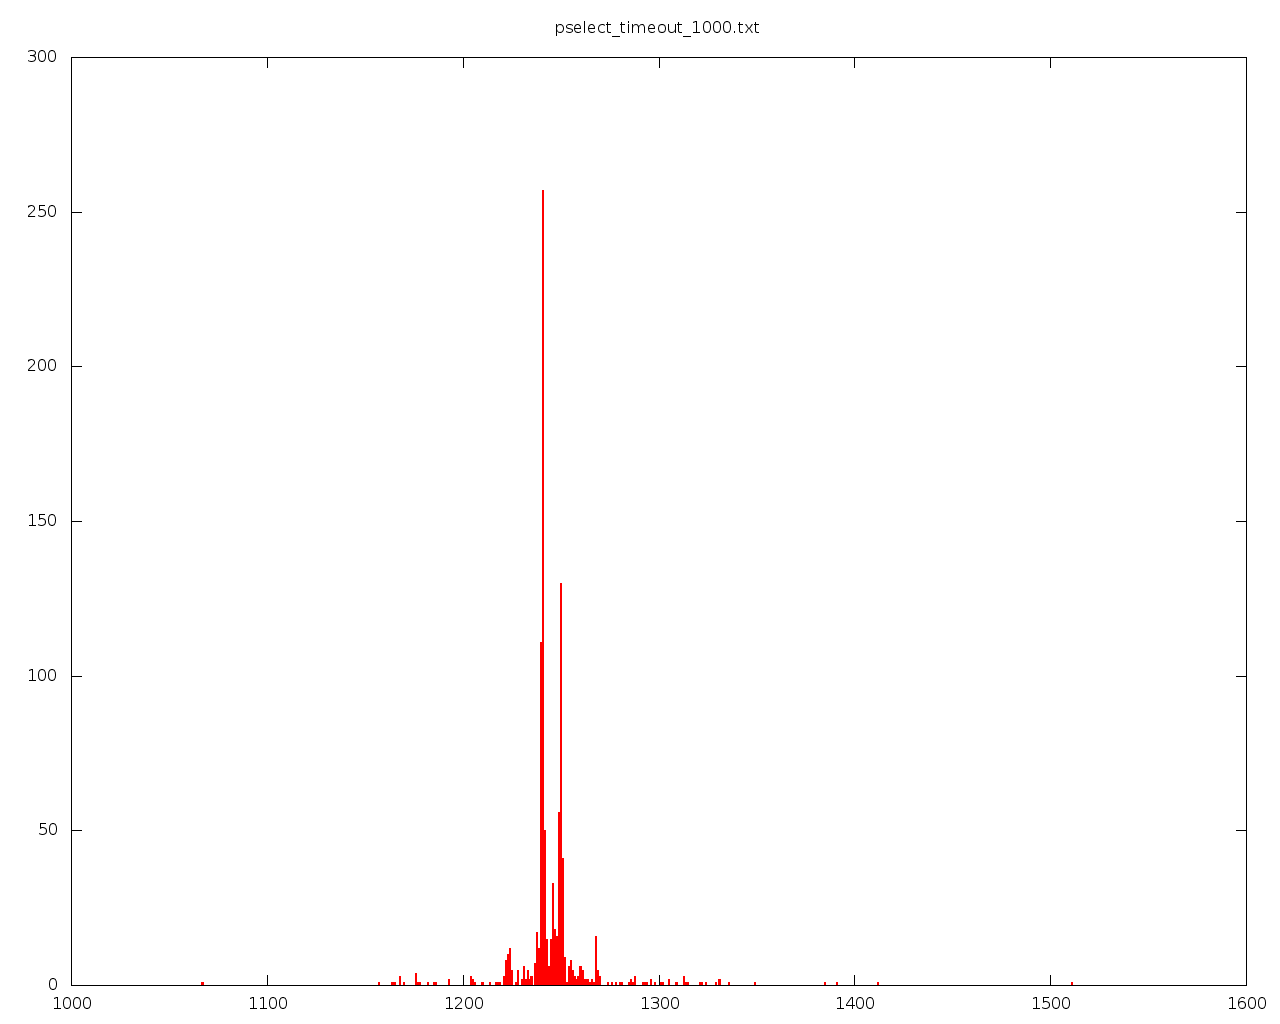
another 70-80us.
Second image (pselect_timeout_1000_fifo_taskset.png) is same test,
but with "chrt -f 50 taskset -c 0 ...".
---
It also seems to slightly matter what CPU I pin it too,
CPU0 is always giving me better numbers:
(measuring just 1000us case)
# for i in `seq 0 4 127`; do echo -n "$i "; chrt -f 50 taskset -c $i ./measure; done
0 min 1016 max 1357 median 1114 mean 1113.19 0.1% 1.00
4 min 1014 max 1260 median 1181 mean 1171.47 0.1% 1.00
8 min 1014 max 1282 median 1192 mean 1189.95 0.1% 1.00
12 min 1011 max 1505 median 1195 mean 1186.83 0.1% 1.00
16 min 1022 max 1446 median 1191 mean 1189.87 0.1% 1.00
20 min 1013 max 1339 median 1195 mean 1190.65 0.1% 1.00
24 min 1016 max 1296 median 1160 mean 1160.90 0.1% 1.00
28 min 1015 max 1267 median 1167 mean 1170.56 0.1% 1.00
32 min 1035 max 1341 median 1194 mean 1191.09 0.1% 1.00
36 min 1013 max 1441 median 1194 mean 1187.54 0.1% 1.00
40 min 1014 max 1378 median 1194 mean 1187.12 0.1% 1.00
44 min 1014 max 1416 median 1195 mean 1194.01 0.1% 1.00
48 min 1016 max 1356 median 1194 mean 1185.55 0.1% 1.00
52 min 1014 max 1433 median 1195 mean 1192.50 0.1% 1.00
56 min 1021 max 1508 median 1195 mean 1192.92 0.1% 1.00
60 min 1014 max 1419 median 1195 mean 1193.41 0.1% 1.00
64 min 1013 max 1403 median 1121 mean 1118.02 0.1% 1.00
68 min 1014 max 1275 median 1180 mean 1165.64 0.1% 1.00
72 min 1020 max 1455 median 1189 mean 1190.73 0.1% 1.00
76 min 1016 max 1376 median 1195 mean 1189.82 0.1% 1.00
80 min 1017 max 1363 median 1192 mean 1191.22 0.1% 1.00
84 min 1013 max 1376 median 1194 mean 1188.59 0.1% 1.00
88 min 1016 max 1469 median 1194 mean 1191.31 0.1% 1.00
92 min 1013 max 1425 median 1195 mean 1192.05 0.1% 1.00
96 min 1016 max 1446 median 1195 mean 1190.17 0.1% 1.00
100 min 1017 max 1411 median 1195 mean 1191.20 0.1% 1.00
104 min 1017 max 1380 median 1194 mean 1193.50 0.1% 1.00
108 min 1016 max 1446 median 1195 mean 1194.53 0.1% 1.00
112 min 1016 max 1355 median 1194 mean 1190.82 0.1% 1.00
116 min 1018 max 1463 median 1194 mean 1190.94 0.1% 1.00
120 min 1089 max 1459 median 1195 mean 1195.75 0.1% 1.00
124 min 1017 max 1441 median 1195 mean 1195.05 0.1% 1.00
# numactl -H
available: 8 nodes (0-7)
node 0 cpus: 0 1 2 3 4 5 6 7 64 65 66 67 68 69 70 71
node 0 size: 7980 MB
node 0 free: 7827 MB
node 1 cpus: 8 9 10 11 12 13 14 15 72 73 74 75 76 77 78 79
node 1 size: 8061 MB
node 1 free: 7821 MB
node 2 cpus: 16 17 18 19 20 21 22 23 80 81 82 83 84 85 86 87
node 2 size: 8061 MB
node 2 free: 7934 MB
node 3 cpus: 24 25 26 27 28 29 30 31 88 89 90 91 92 93 94 95
node 3 size: 8046 MB
node 3 free: 7957 MB
node 4 cpus: 32 33 34 35 36 37 38 39 96 97 98 99 100 101 102 103
node 4 size: 8061 MB
node 4 free: 7932 MB
node 5 cpus: 40 41 42 43 44 45 46 47 104 105 106 107 108 109 110 111
node 5 size: 8061 MB
node 5 free: 7908 MB
node 6 cpus: 48 49 50 51 52 53 54 55 112 113 114 115 116 117 118 119
node 6 size: 8061 MB
node 6 free: 7969 MB
node 7 cpus: 56 57 58 59 60 61 62 63 120 121 122 123 124 125 126 127
node 7 size: 8060 MB
node 7 free: 7971 MB
Regards,
Jan
-------------- next part --------------
A non-text attachment was scrubbed...
Name: pselect_timeout_1000_fifo_taskset.png
Type: image/png
Size: 7900 bytes
Desc: not available
URL: <http://lists.linux.it/pipermail/ltp/attachments/20170602/ea6181f9/attachment-0002.png>
-------------- next part --------------
A non-text attachment was scrubbed...
Name: pselect_timeout_1000.png
Type: image/png
Size: 7857 bytes
Desc: not available
URL: <http://lists.linux.it/pipermail/ltp/attachments/20170602/ea6181f9/attachment-0003.png>
^ permalink raw reply [flat|nested] 19+ messages in thread
end of thread, other threads:[~2017-06-02 12:48 UTC | newest]

Thread overview: 19+ messages (download: mbox.gz follow: Atom feed
-- links below jump to the message on this page --
2017-05-12 14:16 [LTP] [PATCH v2] [RFC] pselect01: Tune thresholds Cyril Hrubis
2017-05-15 10:03 ` Jan Stancek
2017-05-15 10:20   ` Xiao Yang
2017-05-15 13:15     ` Jan Stancek
2017-05-15 13:23       ` Cyril Hrubis
2017-05-15 12:36   ` Cyril Hrubis
2017-05-15 13:00     ` Jan Stancek
2017-05-15 13:13       ` Cyril Hrubis
2017-05-15 13:16         ` Jan Stancek
2017-05-22  8:39         ` Jan Stancek
2017-05-22 12:04           ` Cyril Hrubis
2017-05-22 13:37             ` Jan Stancek
2017-05-22 13:19           ` Cyril Hrubis
2017-05-22 14:57             ` Jan Stancek
2017-05-22 15:15               ` Cyril Hrubis
2017-05-23  7:54                 ` Jan Stancek
2017-05-23  9:16                   ` Cyril Hrubis
2017-05-23  9:45                     ` Jan Stancek
2017-06-02 12:48                       ` Jan Stancek
This is a public inbox, see mirroring instructions
for how to clone and mirror all data and code used for this inbox