* Qdisc: Measuring Head-of-Line blocking with netperf-wrapper
@ 2014-09-15 16:45 Jesper Dangaard Brouer
  2014-09-15 17:10 ` Tom Herbert
  2014-09-16 13:22 ` Jesper Dangaard Brouer
  0 siblings, 2 replies; 13+ messages in thread
From: Jesper Dangaard Brouer @ 2014-09-15 16:45 UTC (permalink / raw)
  To: Eric Dumazet
  Cc: brouer, netdev@vger.kernel.org, Stephen Hemminger, Tom Herbert,
	David Miller, Hannes Frederic Sowa, Daniel Borkmann,
	Florian Westphal, Toke Høiland-Jørgensen, Dave Taht


Hi Eric,

I've constructed a "netperf-wrapper" test for measuring Head-of-Line
blocking, called "tcp_upload_prio", that I hope you will approve of?

 https://github.com/tohojo/netperf-wrapper/commit/1e6b755e8051b6

The basic idea is to have ping packets with TOS bit 0x10, which end-up
in the high-prio band of pfifo_fast.  While two TCP uploads utilize
all the bandwidth.

These high-prio ping packet should then demonstrate the Head-of-Line
blocking occurring due to 1) packets in the HW TX ring buffer, or
2) in the qdisc layers requeue mechanism.  Disgusting these two case
might be a little difficult.


Special care need to be take for using this on the default
qdisc MQ which have pfifo_fast assigned for every HW queue.

Setup requirements:
 1. IRQ align CPUs to NIC HW queues
 2. Force netperf-wrapper subcommands to run the same CPU
  E.g: taskset -c 2 ./netperf-wrapper -H IP tcp_upload_prio

This will force all measurements to go through the same qdisc.  This
is needed so the ping/latency tests measures the real property of
the qdisc and Head-of-Line blocking effect.


Basically the same as:
 sudo taskset -c 2 ping -Q 0x10 192.168.8.2
 sudo taskset -c 2 ping         192.168.8.2
 sudo taskset -c 2 netperf   -H 192.168.8.2 -t TCP_STREAM -l 120
 sudo taskset -c 2 netperf   -H 192.168.8.2 -t TCP_STREAM -l 120
--
Best regards,
  Jesper Dangaard Brouer
  MSc.CS, Sr. Network Kernel Developer at Red Hat
  Author of http://www.iptv-analyzer.org
  LinkedIn: http://www.linkedin.com/in/brouer

^ permalink raw reply	[flat|nested] 13+ messages in thread
* Re: Qdisc: Measuring Head-of-Line blocking with netperf-wrapper
  2014-09-15 16:45 Qdisc: Measuring Head-of-Line blocking with netperf-wrapper Jesper Dangaard Brouer
@ 2014-09-15 17:10 ` Tom Herbert
  2014-09-15 17:24   ` Eric Dumazet
  2014-09-16 13:22 ` Jesper Dangaard Brouer
  1 sibling, 1 reply; 13+ messages in thread
From: Tom Herbert @ 2014-09-15 17:10 UTC (permalink / raw)
  To: Jesper Dangaard Brouer
  Cc: Eric Dumazet, netdev@vger.kernel.org, Stephen Hemminger,
	David Miller, Hannes Frederic Sowa, Daniel Borkmann,
	Florian Westphal, Toke Høiland-Jørgensen, Dave Taht

On Mon, Sep 15, 2014 at 9:45 AM, Jesper Dangaard Brouer
<brouer@redhat.com> wrote:
>
> Hi Eric,
>
> I've constructed a "netperf-wrapper" test for measuring Head-of-Line
> blocking, called "tcp_upload_prio", that I hope you will approve of?
>
>  https://github.com/tohojo/netperf-wrapper/commit/1e6b755e8051b6
>
> The basic idea is to have ping packets with TOS bit 0x10, which end-up
> in the high-prio band of pfifo_fast.  While two TCP uploads utilize
> all the bandwidth.
>
> These high-prio ping packet should then demonstrate the Head-of-Line
> blocking occurring due to 1) packets in the HW TX ring buffer, or
> 2) in the qdisc layers requeue mechanism.  Disgusting these two case
> might be a little difficult.
>
>
>
> Special care need to be take for using this on the default
> qdisc MQ which have pfifo_fast assigned for every HW queue.
>
> Setup requirements:
>  1. IRQ align CPUs to NIC HW queues
>  2. Force netperf-wrapper subcommands to run the same CPU
>   E.g: taskset -c 2 ./netperf-wrapper -H IP tcp_upload_prio
>
> This will force all measurements to go through the same qdisc.  This
> is needed so the ping/latency tests measures the real property of
> the qdisc and Head-of-Line blocking effect.
>
>
> Basically the same as:
>  sudo taskset -c 2 ping -Q 0x10 192.168.8.2
>  sudo taskset -c 2 ping         192.168.8.2
>  sudo taskset -c 2 netperf   -H 192.168.8.2 -t TCP_STREAM -l 120
>  sudo taskset -c 2 netperf   -H 192.168.8.2 -t TCP_STREAM -l 120
> --
ping is a very coarse way to measure latency and in network devices it
doesn't follow same path as TCP/UDP (no 4-tuple for RSS, ECMP) so it's
biased and not a very realistic workload. You might want to try using
netperf TCP_RR at higher priority for a fairer comparison (this is
what I used to verify BQL benefits). Also, you probably want to make
sure to have enough antagonist flows to saturate all links when using
MQ.

> Best regards,
>   Jesper Dangaard Brouer
>   MSc.CS, Sr. Network Kernel Developer at Red Hat
>   Author of http://www.iptv-analyzer.org
>   LinkedIn: http://www.linkedin.com/in/brouer

^ permalink raw reply	[flat|nested] 13+ messages in thread
* Re: Qdisc: Measuring Head-of-Line blocking with netperf-wrapper
  2014-09-15 17:10 ` Tom Herbert
@ 2014-09-15 17:24   ` Eric Dumazet
  2014-09-15 18:55     ` Dave Taht
  2014-09-16  6:30     ` Jesper Dangaard Brouer
  0 siblings, 2 replies; 13+ messages in thread
From: Eric Dumazet @ 2014-09-15 17:24 UTC (permalink / raw)
  To: Tom Herbert
  Cc: Jesper Dangaard Brouer, netdev@vger.kernel.org, Stephen Hemminger,
	David Miller, Hannes Frederic Sowa, Daniel Borkmann,
	Florian Westphal, Toke Høiland-Jørgensen, Dave Taht

On Mon, 2014-09-15 at 10:10 -0700, Tom Herbert wrote:
> On Mon, Sep 15, 2014 at 9:45 AM, Jesper Dangaard Brouer
> <brouer@redhat.com> wrote:
> >
> > Hi Eric,
> >
> > I've constructed a "netperf-wrapper" test for measuring Head-of-Line
> > blocking, called "tcp_upload_prio", that I hope you will approve of?
> >
> >  https://github.com/tohojo/netperf-wrapper/commit/1e6b755e8051b6
> >
> > The basic idea is to have ping packets with TOS bit 0x10, which end-up
> > in the high-prio band of pfifo_fast.  While two TCP uploads utilize
> > all the bandwidth.
> >
> > These high-prio ping packet should then demonstrate the Head-of-Line
> > blocking occurring due to 1) packets in the HW TX ring buffer, or
> > 2) in the qdisc layers requeue mechanism.  Disgusting these two case
> > might be a little difficult.
> >
> >
> >
> > Special care need to be take for using this on the default
> > qdisc MQ which have pfifo_fast assigned for every HW queue.
> >
> > Setup requirements:
> >  1. IRQ align CPUs to NIC HW queues
> >  2. Force netperf-wrapper subcommands to run the same CPU
> >   E.g: taskset -c 2 ./netperf-wrapper -H IP tcp_upload_prio
> >
> > This will force all measurements to go through the same qdisc.  This
> > is needed so the ping/latency tests measures the real property of
> > the qdisc and Head-of-Line blocking effect.
> >
> >
> > Basically the same as:
> >  sudo taskset -c 2 ping -Q 0x10 192.168.8.2
> >  sudo taskset -c 2 ping         192.168.8.2
> >  sudo taskset -c 2 netperf   -H 192.168.8.2 -t TCP_STREAM -l 120
> >  sudo taskset -c 2 netperf   -H 192.168.8.2 -t TCP_STREAM -l 120
> > --
> ping is a very coarse way to measure latency and in network devices it
> doesn't follow same path as TCP/UDP (no 4-tuple for RSS, ECMP) so it's
> biased and not a very realistic workload. You might want to try using
> netperf TCP_RR at higher priority for a fairer comparison (this is
> what I used to verify BQL benefits). Also, you probably want to make
> sure to have enough antagonist flows to saturate all links when using
> MQ.

Right.

Jesper, relevant netperf option is :

    -y local,remote   Set the socket priority

^ permalink raw reply	[flat|nested] 13+ messages in thread
* Re: Qdisc: Measuring Head-of-Line blocking with netperf-wrapper
  2014-09-15 17:24   ` Eric Dumazet
@ 2014-09-15 18:55     ` Dave Taht
  2014-09-15 19:12       ` Rick Jones
  2014-09-16  6:30     ` Jesper Dangaard Brouer
  1 sibling, 1 reply; 13+ messages in thread
From: Dave Taht @ 2014-09-15 18:55 UTC (permalink / raw)
  To: Eric Dumazet
  Cc: Tom Herbert, Jesper Dangaard Brouer, netdev@vger.kernel.org,
	Stephen Hemminger, David Miller, Hannes Frederic Sowa,
	Daniel Borkmann, Florian Westphal,
	Toke Høiland-Jørgensen, Tim Shepard, Avery Pennarun

On Mon, Sep 15, 2014 at 8:24 PM, Eric Dumazet <eric.dumazet@gmail.com> wrote:
> On Mon, 2014-09-15 at 10:10 -0700, Tom Herbert wrote:
>> On Mon, Sep 15, 2014 at 9:45 AM, Jesper Dangaard Brouer
>> <brouer@redhat.com> wrote:
>> >
>> > Hi Eric,
>> >
>> > I've constructed a "netperf-wrapper" test for measuring Head-of-Line
>> > blocking, called "tcp_upload_prio", that I hope you will approve of?
>> >
>> >  https://github.com/tohojo/netperf-wrapper/commit/1e6b755e8051b6
>> >
>> > The basic idea is to have ping packets with TOS bit 0x10, which end-up
>> > in the high-prio band of pfifo_fast.  While two TCP uploads utilize
>> > all the bandwidth.
>> >
>> > These high-prio ping packet should then demonstrate the Head-of-Line
>> > blocking occurring due to 1) packets in the HW TX ring buffer, or
>> > 2) in the qdisc layers requeue mechanism.  Disgusting these two case
>> > might be a little difficult.
>> >
>> >
>> >
>> > Special care need to be take for using this on the default
>> > qdisc MQ which have pfifo_fast assigned for every HW queue.
>> >
>> > Setup requirements:
>> >  1. IRQ align CPUs to NIC HW queues
>> >  2. Force netperf-wrapper subcommands to run the same CPU
>> >   E.g: taskset -c 2 ./netperf-wrapper -H IP tcp_upload_prio
>> >
>> > This will force all measurements to go through the same qdisc.  This
>> > is needed so the ping/latency tests measures the real property of
>> > the qdisc and Head-of-Line blocking effect.
>> >
>> >
>> > Basically the same as:
>> >  sudo taskset -c 2 ping -Q 0x10 192.168.8.2
>> >  sudo taskset -c 2 ping         192.168.8.2
>> >  sudo taskset -c 2 netperf   -H 192.168.8.2 -t TCP_STREAM -l 120
>> >  sudo taskset -c 2 netperf   -H 192.168.8.2 -t TCP_STREAM -l 120
>> > --
>> ping is a very coarse way to measure latency and in network devices it
>> doesn't follow same path as TCP/UDP (no 4-tuple for RSS, ECMP) so it's
>> biased and not a very realistic workload. You might want to try using
>> netperf TCP_RR at higher priority for a fairer comparison (this is
>> what I used to verify BQL benefits). Also, you probably want to make
>> sure to have enough antagonist flows to saturate all links when using
>> MQ.


> Right.
>
> Jesper, relevant netperf option is :
>
>     -y local,remote   Set the socket priority
>
>

Problems with TCP_RR and UDP_RR are that they are subject to a RTO on
packet loss.
The time around a packet loss is "interesting". Secondly, several of
my measurements show that icmp is actually quicker than other code
paths, I figure because a switch to userspace is not needed to handle
the packet.

Outside of ping, the only isochronous packet generation code out there
worth dinking with is owamp,

http://software.internet2.edu/owamp/

And d-itg, at the moment.

There are some neato tools under development for looking at bursty
loss and mixed classifications (see very buggy code in my isochronous
dir on github - I put it down to finish stablizing cerowrt, less buggy
versions are in gfiber's repo which I don't have a link to handy at
the moment)

It would be nice if netperf could sprout a "send a user specified
packet size on this isochronous interval (with a resolution below a
ms) over X transport" test. Or there was something simpler than owamp
but as secure.

--
Dave Täht

https://www.bufferbloat.net/projects/make-wifi-fast

^ permalink raw reply	[flat|nested] 13+ messages in thread
* Re: Qdisc: Measuring Head-of-Line blocking with netperf-wrapper
  2014-09-15 18:55     ` Dave Taht
@ 2014-09-15 19:12       ` Rick Jones
  0 siblings, 0 replies; 13+ messages in thread
From: Rick Jones @ 2014-09-15 19:12 UTC (permalink / raw)
  To: Dave Taht, Eric Dumazet
  Cc: Tom Herbert, Jesper Dangaard Brouer, netdev@vger.kernel.org,
	Stephen Hemminger, David Miller, Hannes Frederic Sowa,
	Daniel Borkmann, Florian Westphal,
	Toke Høiland-Jørgensen, Tim Shepard, Avery Pennarun

On 09/15/2014 11:55 AM, Dave Taht wrote:
> Problems with TCP_RR and UDP_RR are that they are subject to a RTO on
> packet loss.

One possible way to work/kludge around that for TCP_RR would be to have
a burst-mode test with say five or so transactions in flight at one
time.  That then should allow for fast retrans on the occasional
single-packet loss and it will be just an RTT rather than an RTO.  There
would probably be some interactions with cwnd and bundling though upon
that retransmission, even with -D set.

> It would be nice if netperf could sprout a "send a user specified
> packet size on this isochronous interval (with a resolution below a
> ms) over X transport" test. Or there was something simpler than owamp
> but as secure.

If you are willing to let netperf spin (ie burn local CPU on the system
on which netperf is running) over the interval you can configure
--enable-intervals --enable-spin  and then it will spin rather than rely
on the resolution of setitimer().  Then the command line would be
something along the lines of:

netperf -H <destination> -b 1 -w <waittime> -- -m <size>

and it will then make one send of <size> every <waittime>.

happy benchmarking,

rick

^ permalink raw reply	[flat|nested] 13+ messages in thread
* Re: Qdisc: Measuring Head-of-Line blocking with netperf-wrapper
  2014-09-15 17:24   ` Eric Dumazet
  2014-09-15 18:55     ` Dave Taht
@ 2014-09-16  6:30     ` Jesper Dangaard Brouer
  2014-09-16 15:52       ` Tom Herbert
  1 sibling, 1 reply; 13+ messages in thread
From: Jesper Dangaard Brouer @ 2014-09-16  6:30 UTC (permalink / raw)
  To: Eric Dumazet
  Cc: Tom Herbert, netdev@vger.kernel.org, Stephen Hemminger,
	David Miller, Hannes Frederic Sowa, Daniel Borkmann,
	Florian Westphal, Toke Høiland-Jørgensen, Dave Taht,
	brouer

On Mon, 15 Sep 2014 10:24:23 -0700
Eric Dumazet <eric.dumazet@gmail.com> wrote:

> On Mon, 2014-09-15 at 10:10 -0700, Tom Herbert wrote:
> > On Mon, Sep 15, 2014 at 9:45 AM, Jesper Dangaard Brouer
> > <brouer@redhat.com> wrote:
> > >
> > > Hi Eric,
> > >
> > > I've constructed a "netperf-wrapper" test for measuring Head-of-Line
> > > blocking, called "tcp_upload_prio", that I hope you will approve of?
> > >
> > >  https://github.com/tohojo/netperf-wrapper/commit/1e6b755e8051b6
> > >
> > > The basic idea is to have ping packets with TOS bit 0x10, which end-up
> > > in the high-prio band of pfifo_fast.  While two TCP uploads utilize
> > > all the bandwidth.
> > >
> > > These high-prio ping packet should then demonstrate the Head-of-Line
> > > blocking occurring due to 1) packets in the HW TX ring buffer, or
> > > 2) in the qdisc layers requeue mechanism.  Disgusting these two case
> > > might be a little difficult.
> > >
> > >
> > >
> > > Special care need to be take for using this on the default
> > > qdisc MQ which have pfifo_fast assigned for every HW queue.
> > >
> > > Setup requirements:
> > >  1. IRQ align CPUs to NIC HW queues
> > >  2. Force netperf-wrapper subcommands to run the same CPU
> > >   E.g: taskset -c 2 ./netperf-wrapper -H IP tcp_upload_prio
> > >
> > > This will force all measurements to go through the same qdisc.  This
> > > is needed so the ping/latency tests measures the real property of
> > > the qdisc and Head-of-Line blocking effect.
> > >
> > >
> > > Basically the same as:
> > >  sudo taskset -c 2 ping -Q 0x10 192.168.8.2
> > >  sudo taskset -c 2 ping         192.168.8.2
> > >  sudo taskset -c 2 netperf   -H 192.168.8.2 -t TCP_STREAM -l 120
> > >  sudo taskset -c 2 netperf   -H 192.168.8.2 -t TCP_STREAM -l 120
> > > --
> > ping is a very coarse way to measure latency and in network devices it
> > doesn't follow same path as TCP/UDP (no 4-tuple for RSS, ECMP) so it's
> > biased and not a very realistic workload. You might want to try using
> > netperf TCP_RR at higher priority for a fairer comparison (this is
> > what I used to verify BQL benefits).

I worry about starvation, when putting too much/heavy traffic in the
high prio queue.

I've played with UDP_RR (in high prio queue) to measure the latency, it
worked well (much less fluctuations than ping) for GSO and TSO , but
for the none-GSO case it disturbed the two TCP uploads so much, that
they could not utilize the link.

For TCP_RR I worry what happens if a packet loss and RTO happens, but I
guess putting this in the high prio queue should make drops (a lot)
less likely.

> > Also, you probably want to make
> > sure to have enough antagonist flows to saturate all links when using
> > MQ.

For the none-GSO case, I guess adding more TCP uploads might help, but
they might just get starvated.  I'll give it a try.


> Jesper, relevant netperf option is :
>
>     -y local,remote   Set the socket priority

Check, netperf-wrapper already supports setting these.


--
Best regards,
  Jesper Dangaard Brouer
  MSc.CS, Sr. Network Kernel Developer at Red Hat
  Author of http://www.iptv-analyzer.org
  LinkedIn: http://www.linkedin.com/in/brouer

^ permalink raw reply	[flat|nested] 13+ messages in thread
* Re: Qdisc: Measuring Head-of-Line blocking with netperf-wrapper
  2014-09-16  6:30     ` Jesper Dangaard Brouer
@ 2014-09-16 15:52       ` Tom Herbert
  0 siblings, 0 replies; 13+ messages in thread
From: Tom Herbert @ 2014-09-16 15:52 UTC (permalink / raw)
  To: Jesper Dangaard Brouer
  Cc: Eric Dumazet, netdev@vger.kernel.org, Stephen Hemminger,
	David Miller, Hannes Frederic Sowa, Daniel Borkmann,
	Florian Westphal, Toke Høiland-Jørgensen, Dave Taht

On Mon, Sep 15, 2014 at 11:30 PM, Jesper Dangaard Brouer
<brouer@redhat.com> wrote:
> On Mon, 15 Sep 2014 10:24:23 -0700
> Eric Dumazet <eric.dumazet@gmail.com> wrote:
>
>> On Mon, 2014-09-15 at 10:10 -0700, Tom Herbert wrote:
>> > On Mon, Sep 15, 2014 at 9:45 AM, Jesper Dangaard Brouer
>> > <brouer@redhat.com> wrote:
>> > >
>> > > Hi Eric,
>> > >
>> > > I've constructed a "netperf-wrapper" test for measuring Head-of-Line
>> > > blocking, called "tcp_upload_prio", that I hope you will approve of?
>> > >
>> > >  https://github.com/tohojo/netperf-wrapper/commit/1e6b755e8051b6
>> > >
>> > > The basic idea is to have ping packets with TOS bit 0x10, which end-up
>> > > in the high-prio band of pfifo_fast.  While two TCP uploads utilize
>> > > all the bandwidth.
>> > >
>> > > These high-prio ping packet should then demonstrate the Head-of-Line
>> > > blocking occurring due to 1) packets in the HW TX ring buffer, or
>> > > 2) in the qdisc layers requeue mechanism.  Disgusting these two case
>> > > might be a little difficult.
>> > >
>> > >
>> > >
>> > > Special care need to be take for using this on the default
>> > > qdisc MQ which have pfifo_fast assigned for every HW queue.
>> > >
>> > > Setup requirements:
>> > >  1. IRQ align CPUs to NIC HW queues
>> > >  2. Force netperf-wrapper subcommands to run the same CPU
>> > >   E.g: taskset -c 2 ./netperf-wrapper -H IP tcp_upload_prio
>> > >
>> > > This will force all measurements to go through the same qdisc.  This
>> > > is needed so the ping/latency tests measures the real property of
>> > > the qdisc and Head-of-Line blocking effect.
>> > >
>> > >
>> > > Basically the same as:
>> > >  sudo taskset -c 2 ping -Q 0x10 192.168.8.2
>> > >  sudo taskset -c 2 ping         192.168.8.2
>> > >  sudo taskset -c 2 netperf   -H 192.168.8.2 -t TCP_STREAM -l 120
>> > >  sudo taskset -c 2 netperf   -H 192.168.8.2 -t TCP_STREAM -l 120
>> > > --
>> > ping is a very coarse way to measure latency and in network devices it
>> > doesn't follow same path as TCP/UDP (no 4-tuple for RSS, ECMP) so it's
>> > biased and not a very realistic workload. You might want to try using
>> > netperf TCP_RR at higher priority for a fairer comparison (this is
>> > what I used to verify BQL benefits).
>
> I worry about starvation, when putting too much/heavy traffic in the
> high prio queue.
>
Each TCP_RR flow only has one packet outstanding by default.

> I've played with UDP_RR (in high prio queue) to measure the latency, it
> worked well (much less fluctuations than ping) for GSO and TSO , but
> for the none-GSO case it disturbed the two TCP uploads so much, that
> they could not utilize the link.
>
> For TCP_RR I worry what happens if a packet loss and RTO happens, but I
> guess putting this in the high prio queue should make drops (a lot)
> less likely.
>
Are you actually seeing packet loss when you run tour test? If you're
testing between two hosts in a controlled environment, you should be
able to configure test parameters for no loss.

>> > Also, you probably want to make
>> > sure to have enough antagonist flows to saturate all links when using
>> > MQ.
>
> For the none-GSO case, I guess adding more TCP uploads might help, but
> they might just get starvated.  I'll give it a try.
>
>
>> Jesper, relevant netperf option is :
>>
>>     -y local,remote   Set the socket priority
>
> Check, netperf-wrapper already supports setting these.
>
>
> --
> Best regards,
>   Jesper Dangaard Brouer
>   MSc.CS, Sr. Network Kernel Developer at Red Hat
>   Author of http://www.iptv-analyzer.org
>   LinkedIn: http://www.linkedin.com/in/brouer

^ permalink raw reply	[flat|nested] 13+ messages in thread
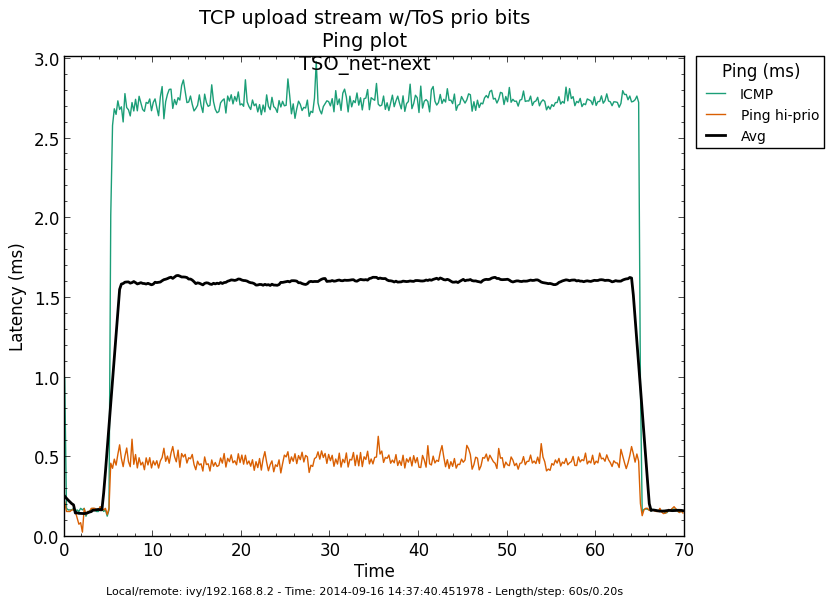
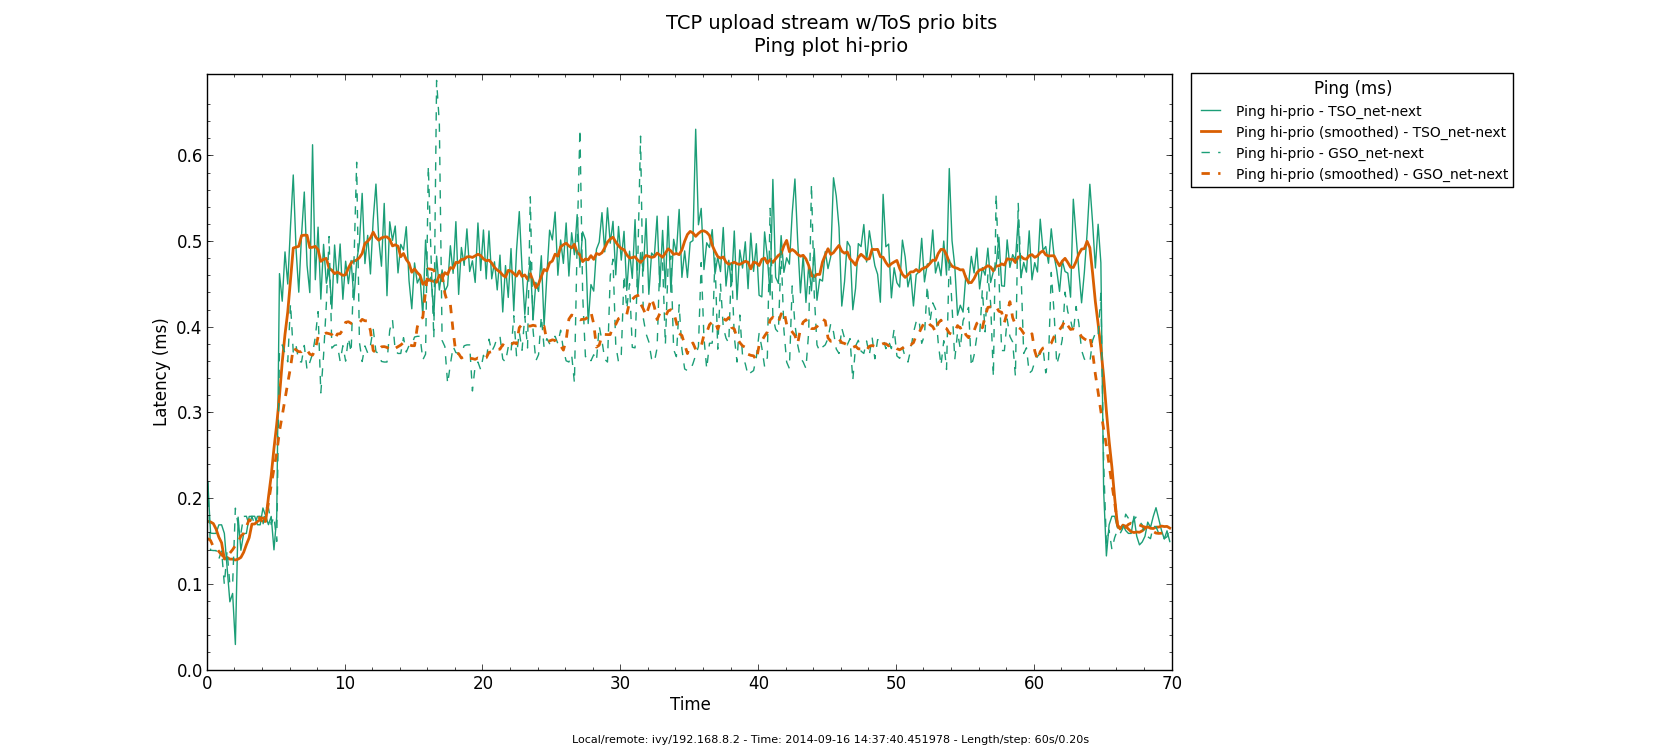
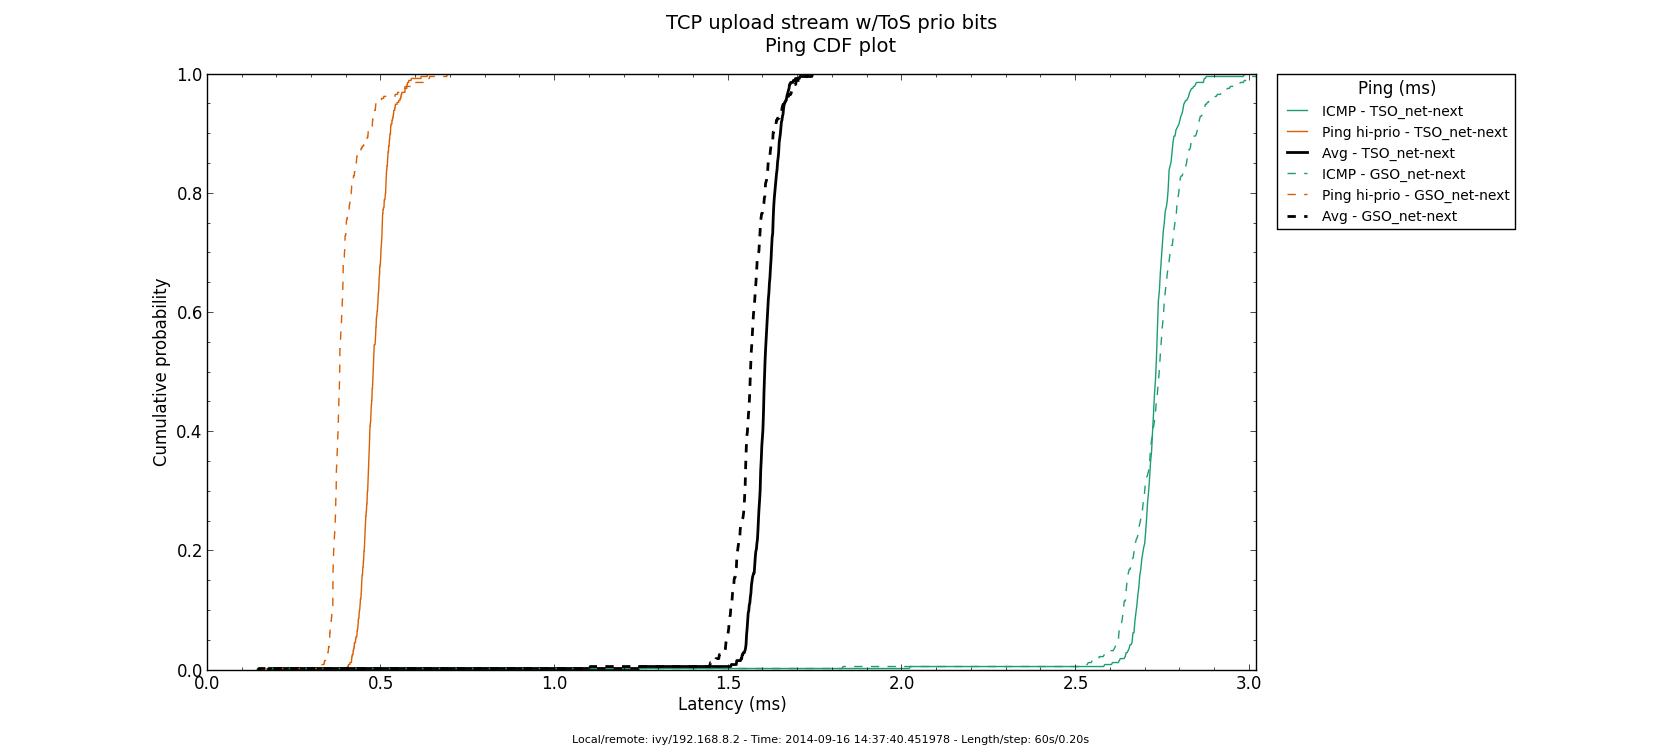
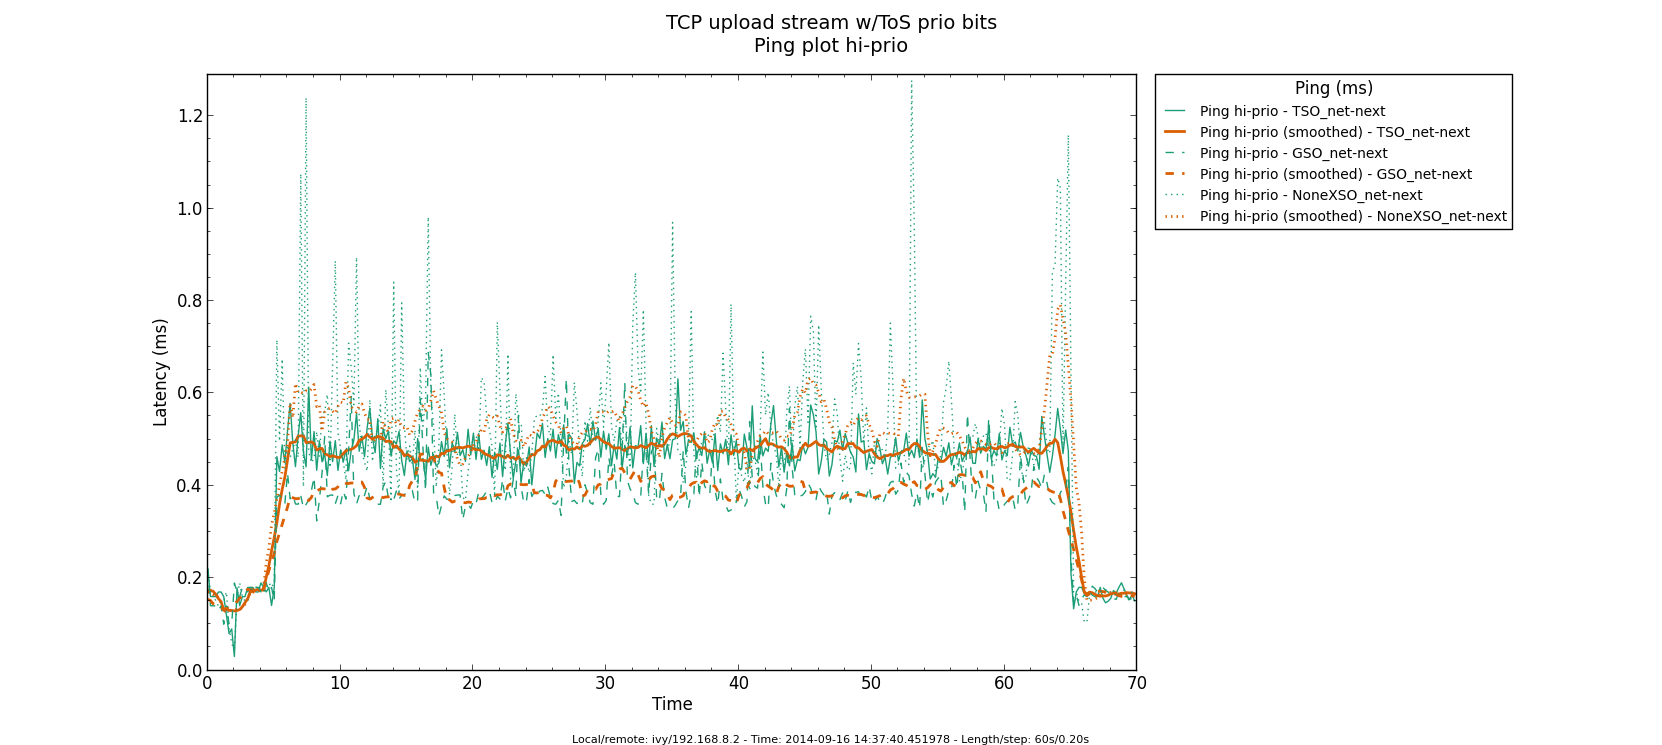
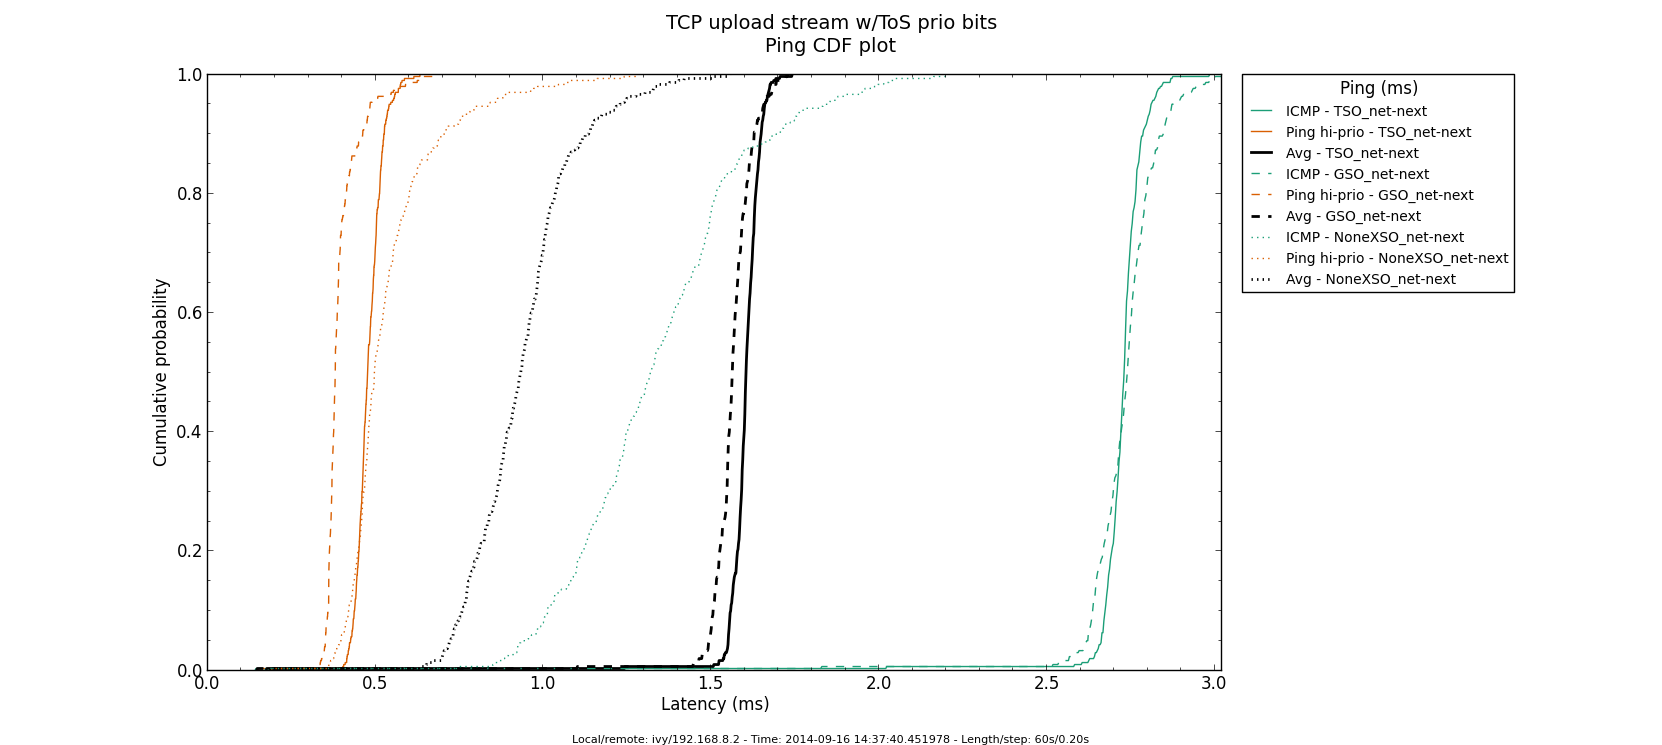
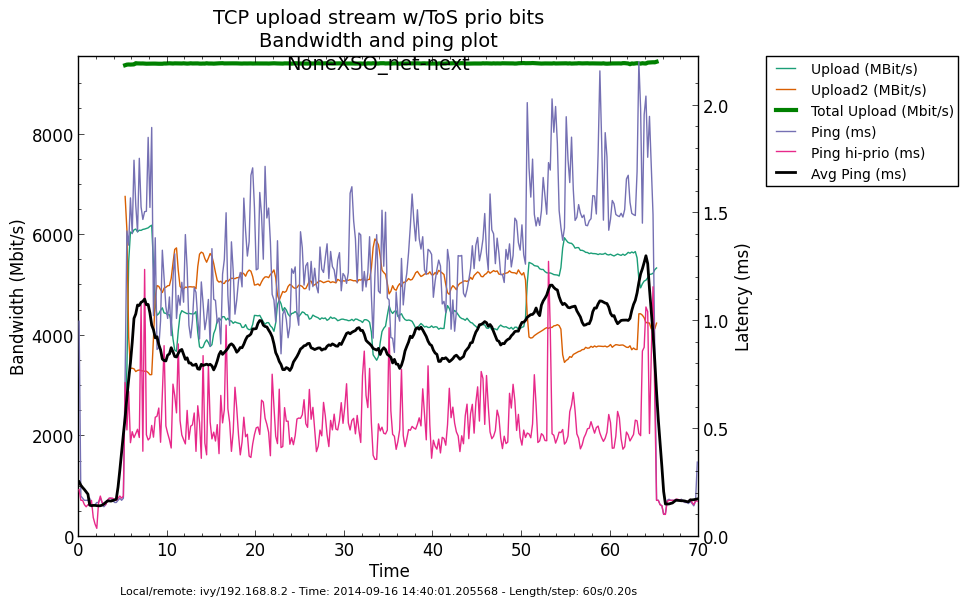
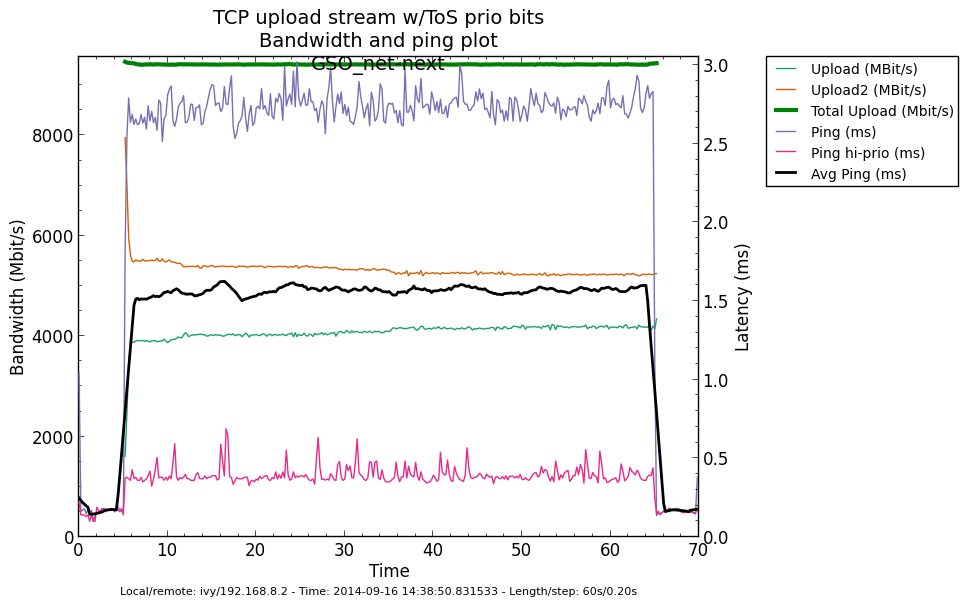
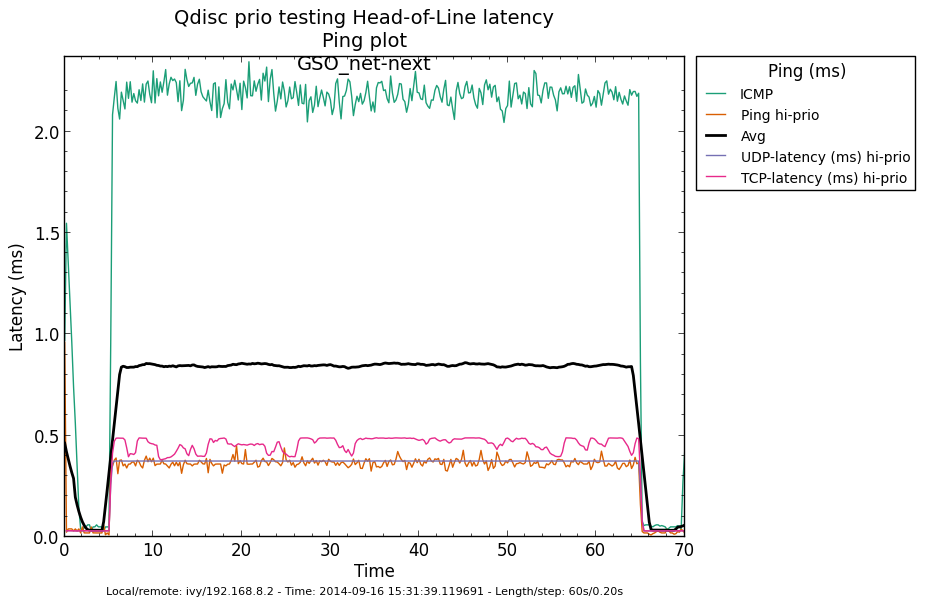
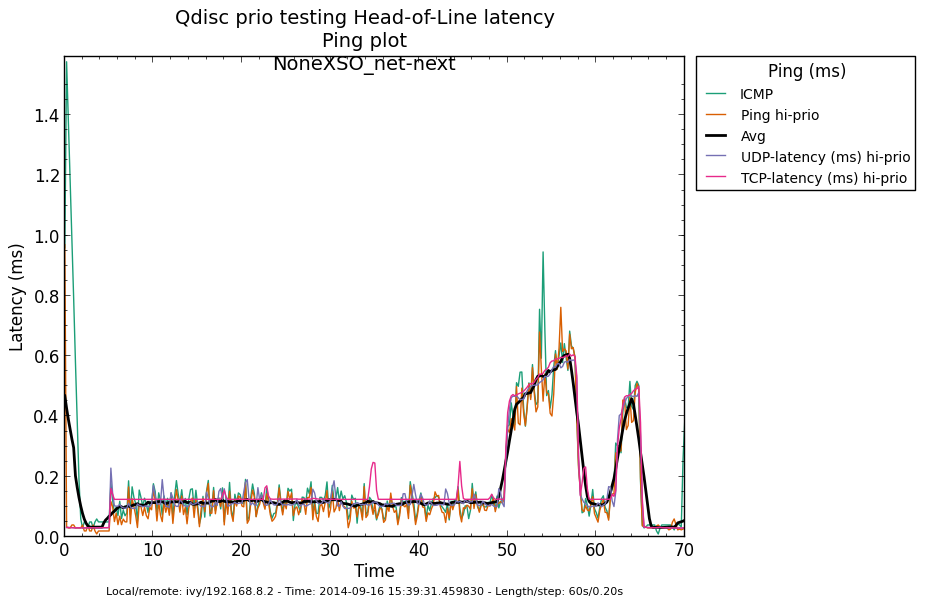
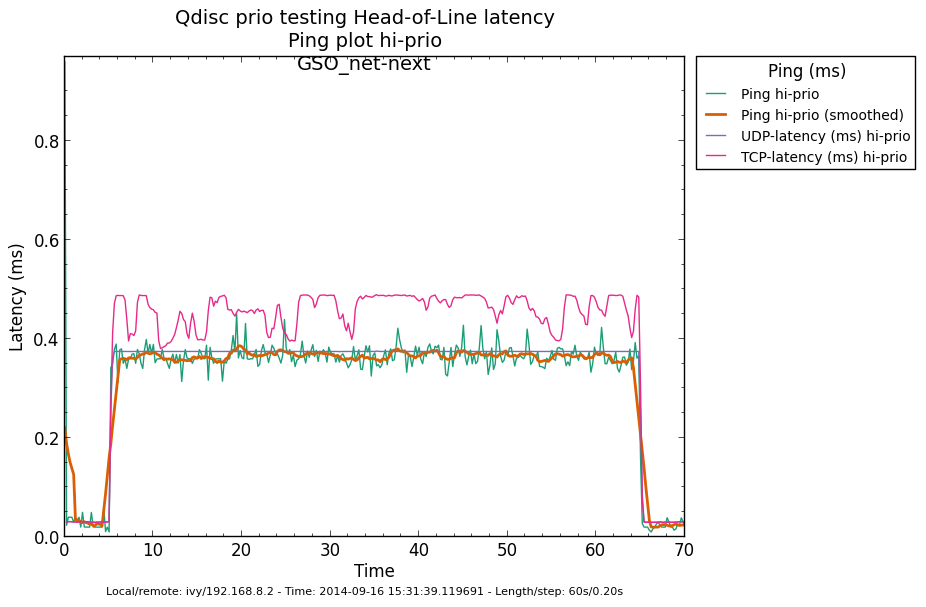
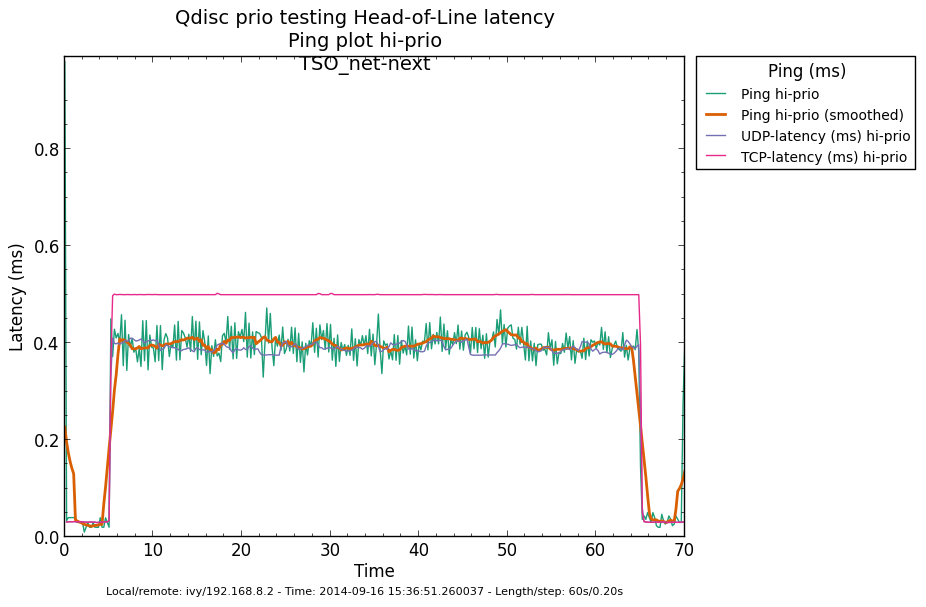
* Re: Qdisc: Measuring Head-of-Line blocking with netperf-wrapper
  2014-09-15 16:45 Qdisc: Measuring Head-of-Line blocking with netperf-wrapper Jesper Dangaard Brouer
  2014-09-15 17:10 ` Tom Herbert
@ 2014-09-16 13:22 ` Jesper Dangaard Brouer
  2014-09-16 13:59   ` Eric Dumazet
  1 sibling, 1 reply; 13+ messages in thread
From: Jesper Dangaard Brouer @ 2014-09-16 13:22 UTC (permalink / raw)
  To: Jesper Dangaard Brouer
  Cc: Eric Dumazet, netdev@vger.kernel.org, Stephen Hemminger,
	Tom Herbert, David Miller, Hannes Frederic Sowa, Daniel Borkmann,
	Florian Westphal, Toke Høiland-Jørgensen, Dave Taht

On Mon, 15 Sep 2014 18:45:17 +0200
Jesper Dangaard Brouer <brouer@redhat.com> wrote:

> I've constructed a "netperf-wrapper" test for measuring Head-of-Line
> blocking, called "tcp_upload_prio", that I hope you will approve of?
>
>  https://github.com/tohojo/netperf-wrapper/commit/1e6b755e8051b6
>
> The basic idea is to have ping packets with TOS bit 0x10, which end-up
> in the high-prio band of pfifo_fast.  While two TCP uploads utilize
> all the bandwidth.
>
> These high-prio ping packet should then demonstrate the Head-of-Line
> blocking occurring due to 1) packets in the HW TX ring buffer, or
> 2) in the qdisc layers requeue mechanism.  Disgusting these two case
> might be a little difficult.

Let me demonstrate some the results with some graphs. I'm comparing
same kernel (net-next at c0d1379a) with different TSO, GSO and
disabled-TSO+GSO:

Test TYPES are:
- TSO     == ethtool -K eth4 gro on  gso on  tso on
- GSO     == ethtool -K eth4 gro on  gso on  tso off
- NoneXSO == ethtool -K eth4 gro off gso off tso off

A ping graph for with TSO enabled looks like:
 http://people.netfilter.org/hawk/qdisc/measure01/tcp_upload_prio__ping--TSO_net_next.png

- It clearly shows that we can measure the difference between the
  best-effort and high-priority ping packets.


Zooming in on high-prio ping only, and comparing TSO vs GSO:
 http://people.netfilter.org/hawk/qdisc/measure01/compare_TSO_vs_GSO__ping_hiprio.png
 http://people.netfilter.org/hawk/qdisc/measure01/compare_TSO_vs_GSO__ping_cdf.png

- It clearly shows that GSO have lower/better ping values that TSO,
  e.g. smaller HoL blocking


When adding the NoneXSO to the high-prio compare:
 http://people.netfilter.org/hawk/qdisc/measure01/compare_TSO_vs_GSO_vs_NoneXSO__ping_hiprio.png
 http://people.netfilter.org/hawk/qdisc/measure01/compare_TSO_vs_GSO_vs_NoneXSO__ping_cdf.png

- Then it look a little strange, because the none-GSO/TSO setting looks
  like it have larger Head-of-Line blocking delays.  Something I was
  not expecting.

Do notice that the NoneXSO case have a lower overall/average latency,
likely due to 1) TSO and GSO can put more "bytes" into the qdisc's 1000
packet limit, 2) NoneXSO have more difficulties exausting all
bandwidth, see graph:
 http://people.netfilter.org/hawk/qdisc/measure01/tcp_upload_prio__totals--NoneXSO_net_next.png
vs a more stable TCP speeds with GSO:
 http://people.netfilter.org/hawk/qdisc/measure01/tcp_upload_prio__totals--GSO_net_next.png

--
Best regards,
  Jesper Dangaard Brouer
  MSc.CS, Sr. Network Kernel Developer at Red Hat
  Author of http://www.iptv-analyzer.org
  LinkedIn: http://www.linkedin.com/in/brouer

^ permalink raw reply	[flat|nested] 13+ messages in thread
* Re: Qdisc: Measuring Head-of-Line blocking with netperf-wrapper
  2014-09-16 13:22 ` Jesper Dangaard Brouer
@ 2014-09-16 13:59   ` Eric Dumazet
  2014-09-16 15:56     ` Jesper Dangaard Brouer
  0 siblings, 1 reply; 13+ messages in thread
From: Eric Dumazet @ 2014-09-16 13:59 UTC (permalink / raw)
  To: Jesper Dangaard Brouer
  Cc: netdev@vger.kernel.org, Stephen Hemminger, Tom Herbert,
	David Miller, Hannes Frederic Sowa, Daniel Borkmann,
	Florian Westphal, Toke Høiland-Jørgensen, Dave Taht

On Tue, 2014-09-16 at 15:22 +0200, Jesper Dangaard Brouer wrote:

> Zooming in on high-prio ping only, and comparing TSO vs GSO:
>  http://people.netfilter.org/hawk/qdisc/measure01/compare_TSO_vs_GSO__ping_hiprio.png
>  http://people.netfilter.org/hawk/qdisc/measure01/compare_TSO_vs_GSO__ping_cdf.png
>
> - It clearly shows that GSO have lower/better ping values that TSO,
>   e.g. smaller HoL blocking

If you use a single TX queue on the NIC (no prio aware), this makes no
sense....

GSO is exactly sending the same packet train on the wire, it only uses
more cpu on the host to segment packets. While doing the segmentation,
no packet can be sent to the NIC, so this should be _adding_ some
latencies, unless the TSO engine on your NIC is brain damaged.

The high prio ping packet cannot be inserted in the middle of a GSO
train.

ping is not very good to measure very small rtt actually.

With the TCP usec rtt work I did lately, you'll get more precise results
from a TCP_RR flow, as Tom and I explained.

Proof :

lpaa23:~# ping -n -c 10 10.246.7.152
PING 10.246.7.152 (10.246.7.152) 56(84) bytes of data.
64 bytes from 10.246.7.152: icmp_req=1 ttl=64 time=0.196 ms
64 bytes from 10.246.7.152: icmp_req=2 ttl=64 time=0.161 ms
64 bytes from 10.246.7.152: icmp_req=3 ttl=64 time=0.183 ms
64 bytes from 10.246.7.152: icmp_req=4 ttl=64 time=0.070 ms
64 bytes from 10.246.7.152: icmp_req=5 ttl=64 time=0.195 ms
64 bytes from 10.246.7.152: icmp_req=6 ttl=64 time=0.163 ms
64 bytes from 10.246.7.152: icmp_req=7 ttl=64 time=0.169 ms
64 bytes from 10.246.7.152: icmp_req=8 ttl=64 time=0.183 ms
64 bytes from 10.246.7.152: icmp_req=9 ttl=64 time=0.150 ms
64 bytes from 10.246.7.152: icmp_req=10 ttl=64 time=0.208 ms

--- 10.246.7.152 ping statistics ---
10 packets transmitted, 10 received, 0% packet loss, time 8999ms
rtt min/avg/max/mdev = 0.070/0.167/0.208/0.040 ms

While with TCP_RR, you'll get the ~20 usec rtt we really have on this
link :


netperf -H 10.246.7.152 -t TCP_RR -l 100 &
ss -temoi dst 10.246.7.152

...
ESTAB       0      1
10.246.7.151:59804
10.246.7.152:45623    timer:(on,201ms,0) ino:14821 sk:ffff881fcb48a740
<->
	 skmem:(r0,rb357120,t2304,tb46080,f1792,w2304,o0,bl0) ts sack cubic
wscale:6,6 rto:201 rtt:0.019/0.003 ato:40 mss:1448 cwnd:10 send
6096.8Mbps pacing_rate 11656.9Mbps unacked:1 rcv_rtt:572 rcv_space:29470

And if you take a look at tcpdump, you'll see that 20 usec is the
reality.

lpaa23:~# tcpdump -p -n -s 128 -i eth0 -c 10 host 10.246.7.152
tcpdump: verbose output suppressed, use -v or -vv for full protocol decode
listening on eth0, link-type EN10MB (Ethernet), capture size 128 bytes
06:53:59.278218 IP 10.246.7.152.43699 > 10.246.7.151.49454: P 1088080991:1088080992(1) ack 811259668 win 453 <nop,nop,timestamp 1151215 1152060>
06:53:59.278260 IP 10.246.7.151.49454 > 10.246.7.152.43699: P 1:2(1) ack 1 win 457 <nop,nop,timestamp 1152060 1151215>
06:53:59.278268 IP 10.246.7.152.43699 > 10.246.7.151.49454: P 1:2(1) ack 2 win 453 <nop,nop,timestamp 1151215 1152060>
06:53:59.278220 IP 10.246.7.151.49454 > 10.246.7.152.43699: P 2:3(1) ack 2 win 457 <nop,nop,timestamp 1152060 1151215>
06:53:59.278232 IP 10.246.7.152.43699 > 10.246.7.151.49454: P 2:3(1) ack 3 win 453 <nop,nop,timestamp 1151215 1152060>
06:53:59.278240 IP 10.246.7.151.49454 > 10.246.7.152.43699: P 3:4(1) ack 3 win 457 <nop,nop,timestamp 1152060 1151215>
06:53:59.278252 IP 10.246.7.152.43699 > 10.246.7.151.49454: P 3:4(1) ack 4 win 453 <nop,nop,timestamp 1151215 1152060>
06:53:59.278259 IP 10.246.7.151.49454 > 10.246.7.152.43699: P 4:5(1) ack 4 win 457 <nop,nop,timestamp 1152060 1151215>
06:53:59.278282 IP 10.246.7.152.43699 > 10.246.7.151.49454: P 4:5(1) ack 5 win 453 <nop,nop,timestamp 1151215 1152060>
06:53:59.278289 IP 10.246.7.151.49454 > 10.246.7.152.43699: P 5:6(1) ack 5 win 457 <nop,nop,timestamp 1152060 1151215>

ping is slower :

lpaa23:~# tcpdump -p -n -s 128 -i eth0 -c 10 host 10.246.7.152
tcpdump: verbose output suppressed, use -v or -vv for full protocol decode
listening on eth0, link-type EN10MB (Ethernet), capture size 128 bytes
06:57:29.666168 IP 10.246.7.151 > 10.246.7.152: ICMP echo request, id 11062, seq 4, length 64
06:57:29.666355 IP 10.246.7.152 > 10.246.7.151: ICMP echo reply, id 11062, seq 4, length 64
06:57:30.666220 IP 10.246.7.151 > 10.246.7.152: ICMP echo request, id 11062, seq 5, length 64
06:57:30.666408 IP 10.246.7.152 > 10.246.7.151: ICMP echo reply, id 11062, seq 5, length 64
06:57:31.666147 IP 10.246.7.151 > 10.246.7.152: ICMP echo request, id 11062, seq 6, length 64
06:57:31.666333 IP 10.246.7.152 > 10.246.7.151: ICMP echo reply, id 11062, seq 6, length 64
06:57:32.666164 IP 10.246.7.151 > 10.246.7.152: ICMP echo request, id 11062, seq 7, length 64
06:57:32.666359 IP 10.246.7.152 > 10.246.7.151: ICMP echo reply, id 11062, seq 7, length 64

Really, do not rely too much on ping.
If you do, we cant really trust your results.

^ permalink raw reply	[flat|nested] 13+ messages in thread
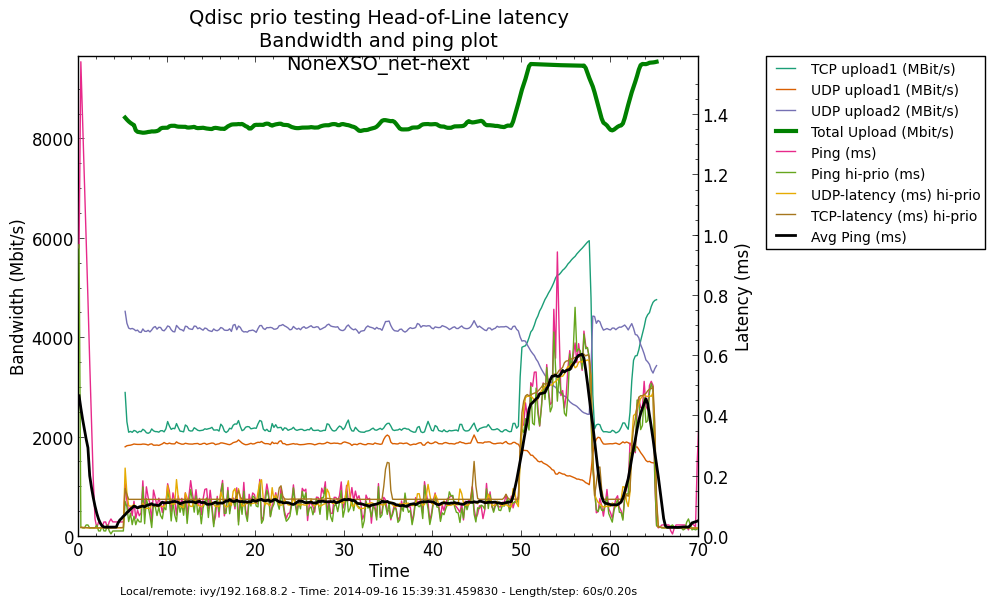
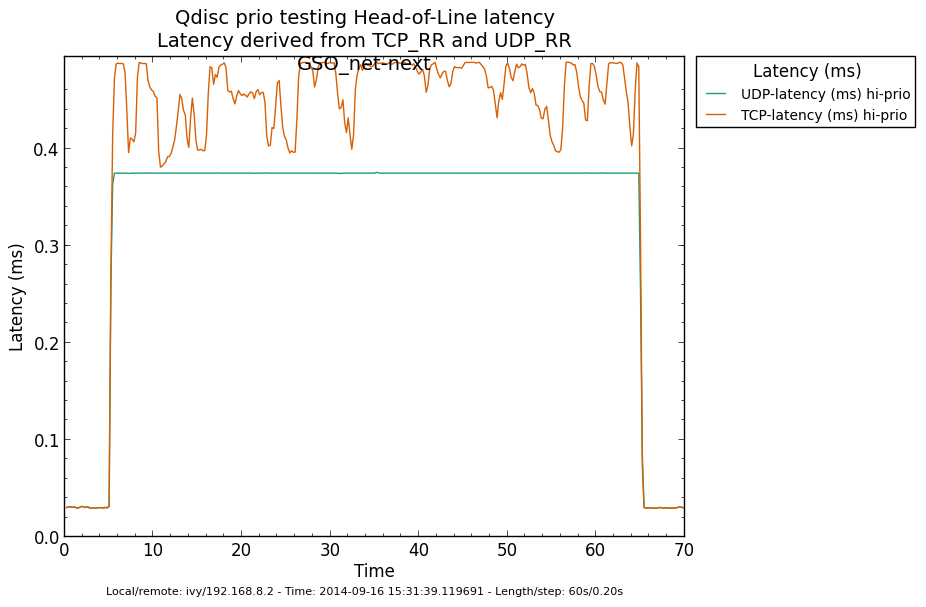
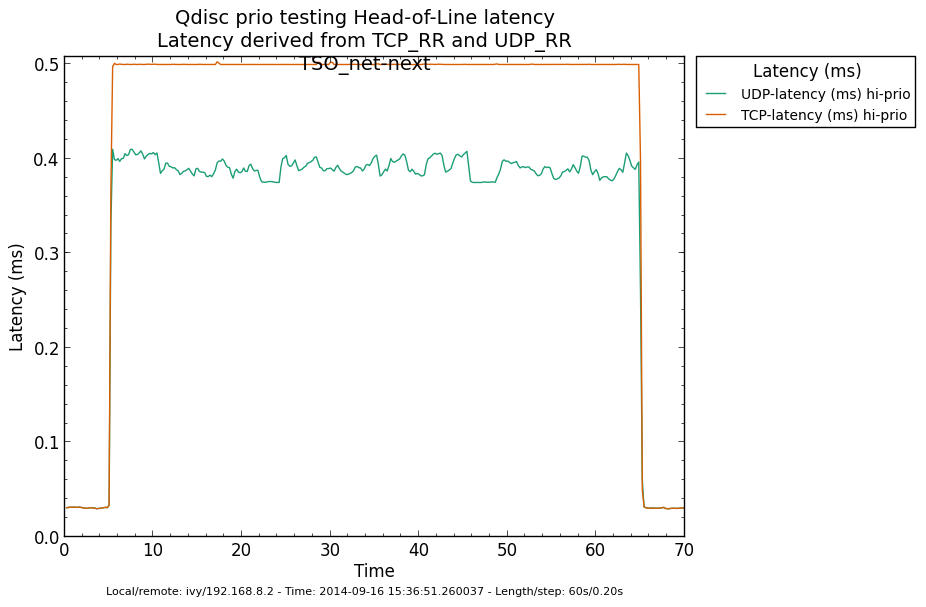
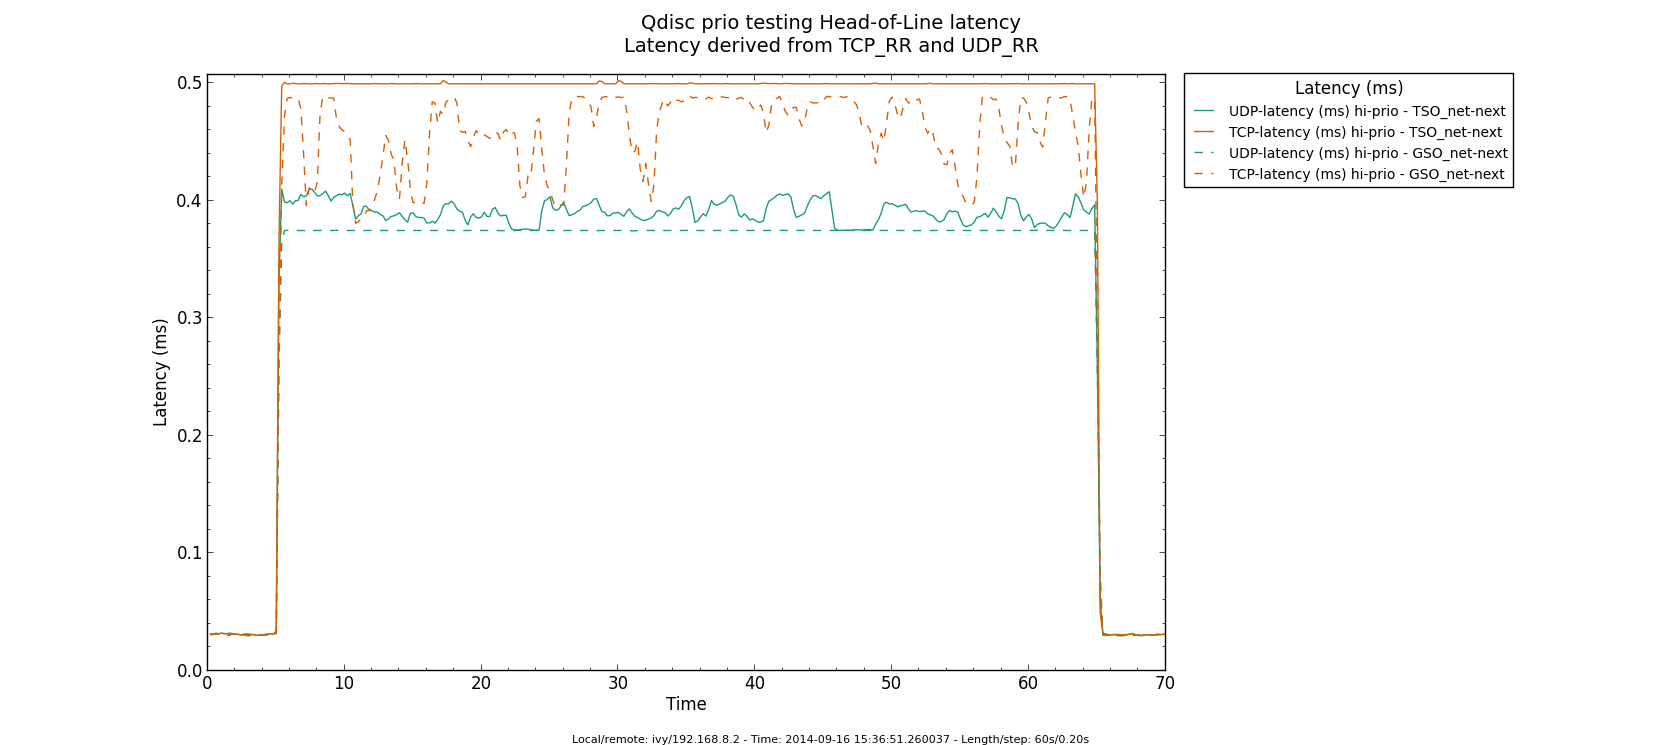
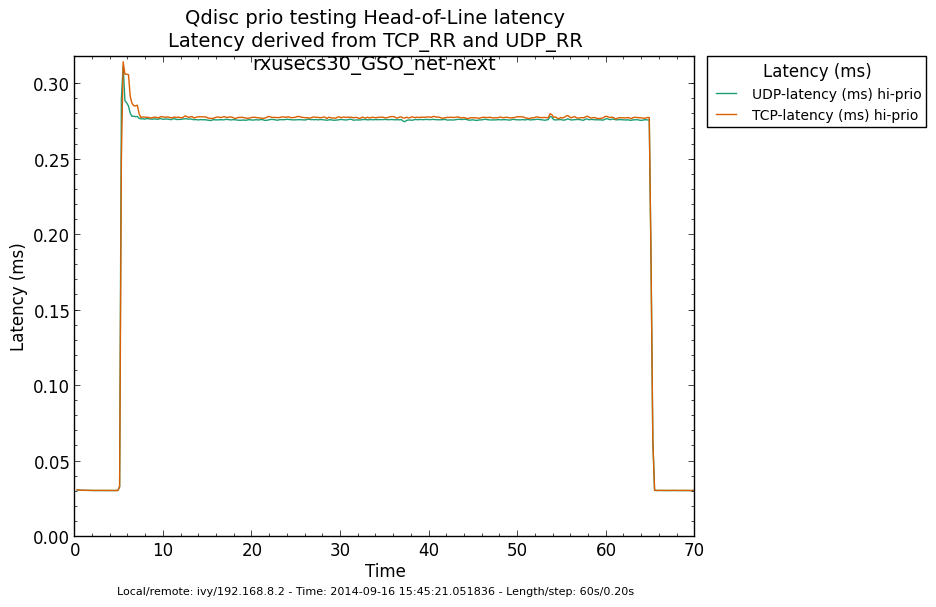
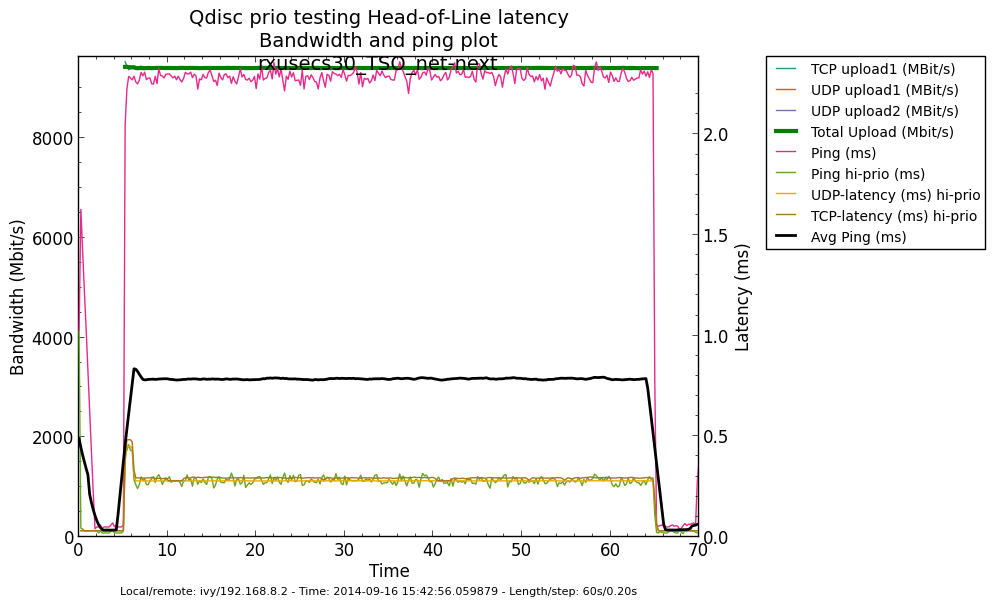
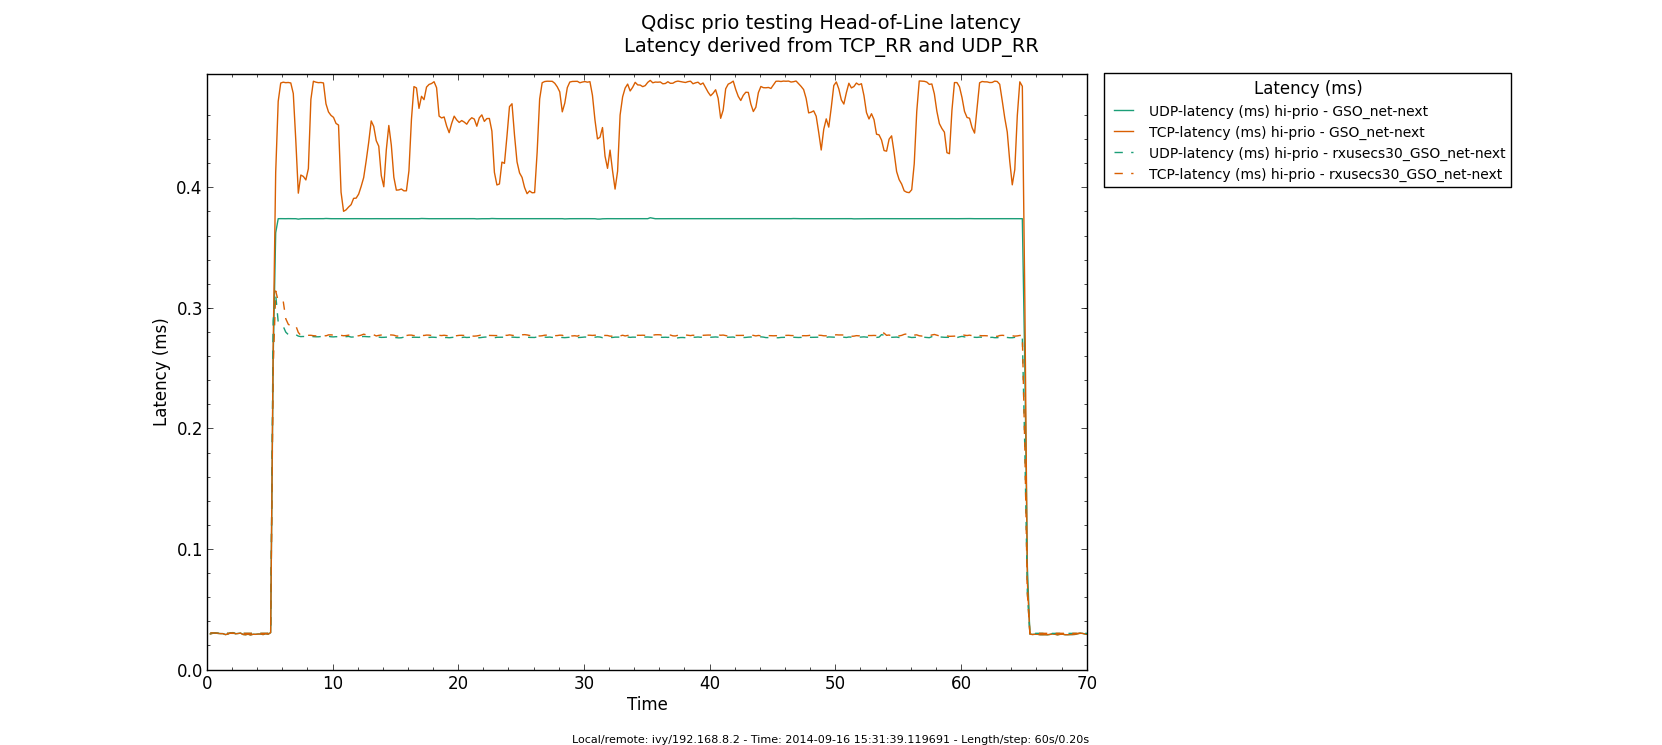
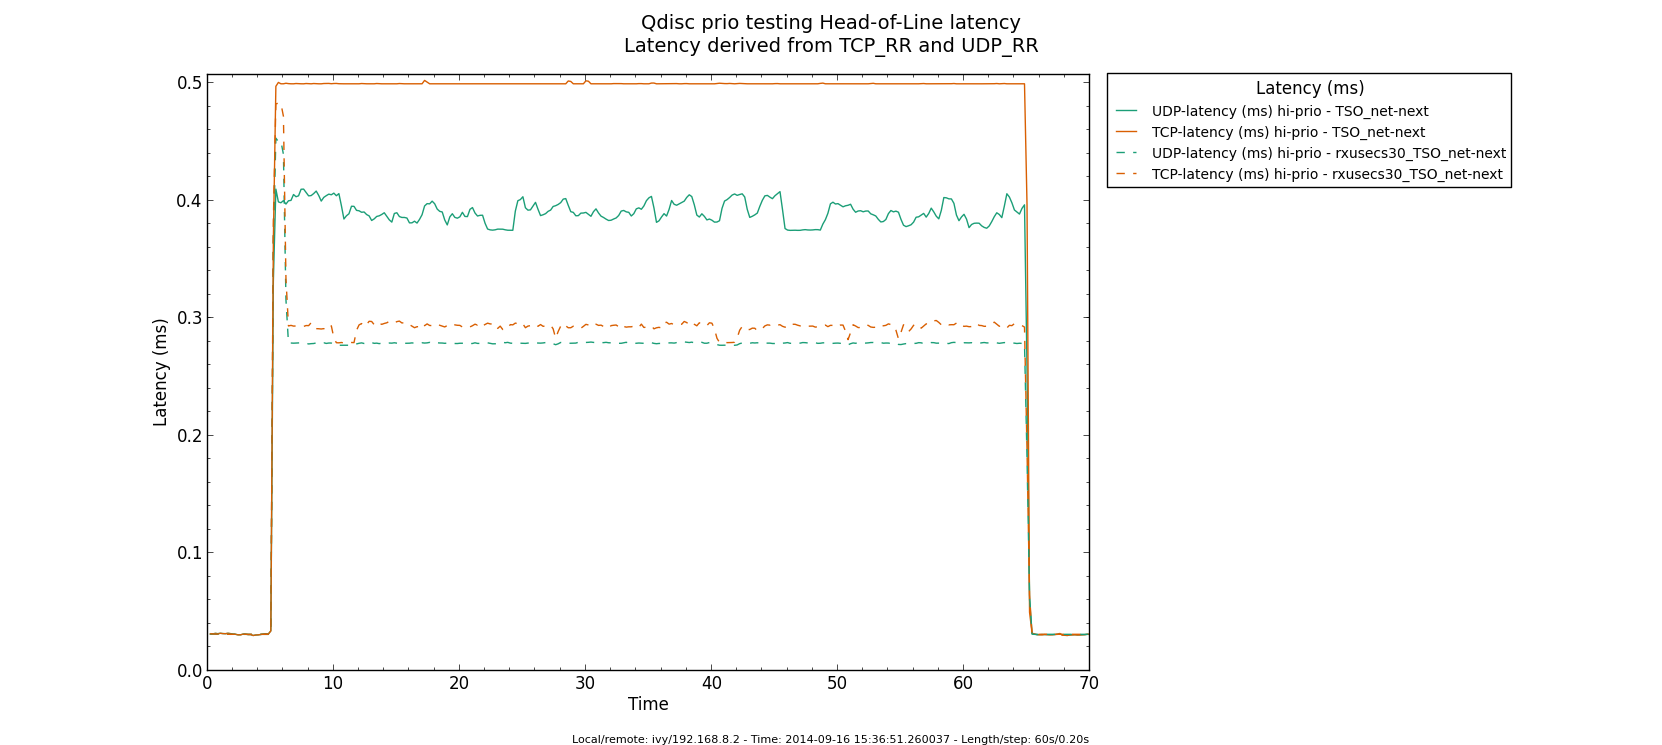
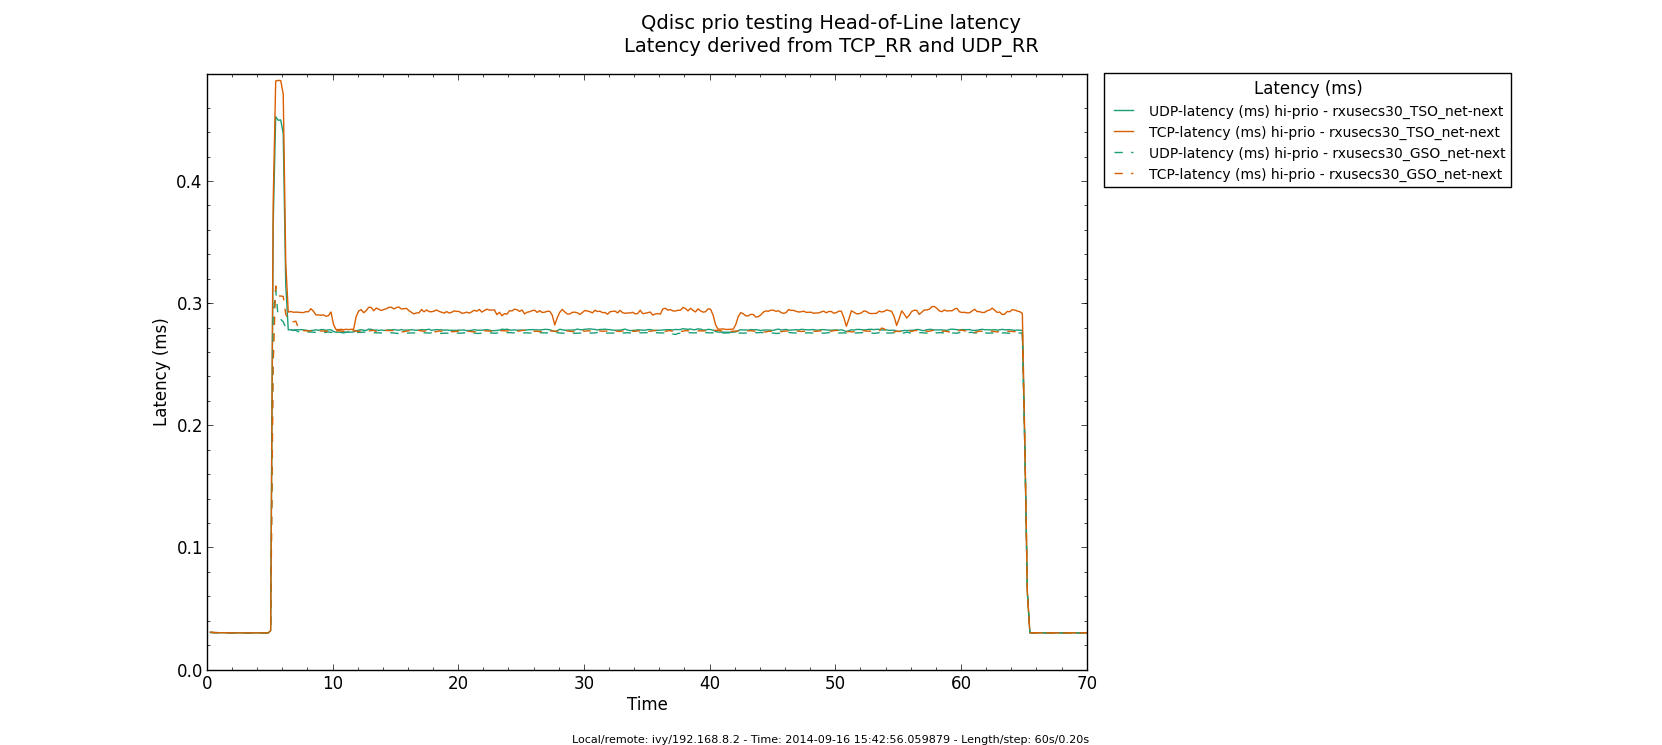
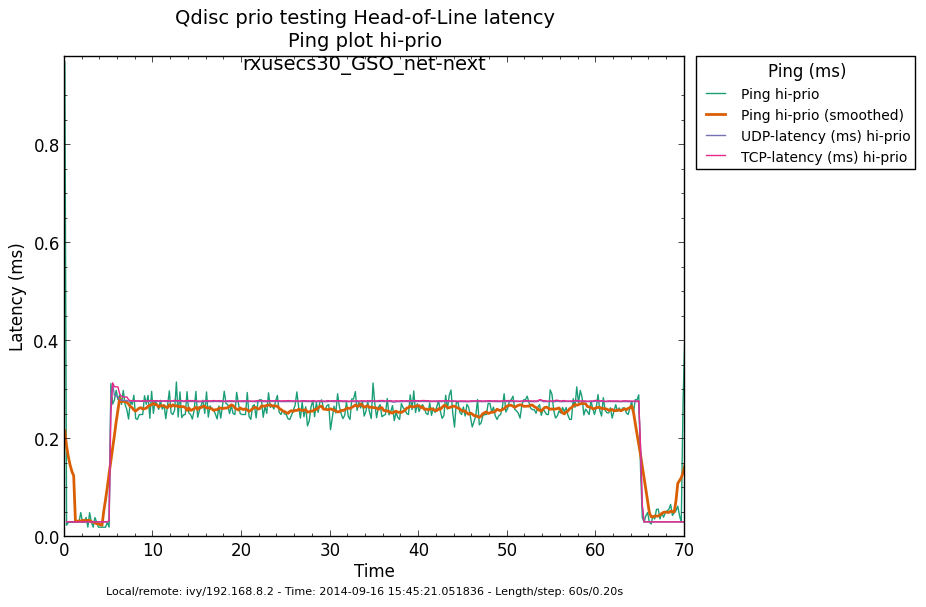
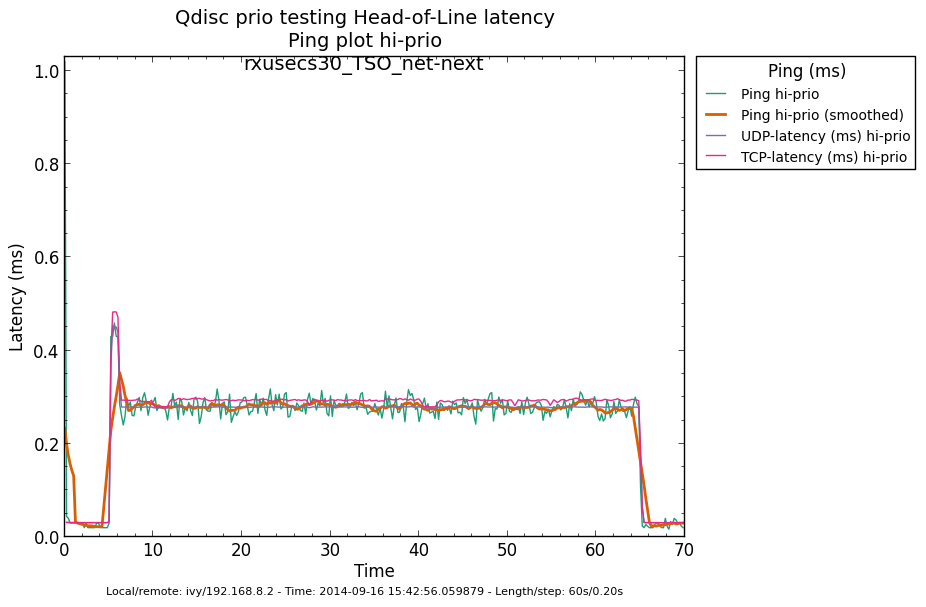
* Re: Qdisc: Measuring Head-of-Line blocking with netperf-wrapper
  2014-09-16 13:59   ` Eric Dumazet
@ 2014-09-16 15:56     ` Jesper Dangaard Brouer
  2014-09-16 16:08       ` Dave Taht
  2014-09-16 16:30       ` Eric Dumazet
  0 siblings, 2 replies; 13+ messages in thread
From: Jesper Dangaard Brouer @ 2014-09-16 15:56 UTC (permalink / raw)
  To: Eric Dumazet
  Cc: netdev@vger.kernel.org, Stephen Hemminger, Tom Herbert,
	David Miller, Hannes Frederic Sowa, Daniel Borkmann,
	Florian Westphal, Toke Høiland-Jørgensen, Dave Taht,
	brouer

On Tue, 16 Sep 2014 06:59:19 -0700
Eric Dumazet <eric.dumazet@gmail.com> wrote:

> With the TCP usec rtt work I did lately, you'll get more precise results
> from a TCP_RR flow, as Tom and I explained.

Here you go, developed a new test:
 http://people.netfilter.org/hawk/qdisc/experiment01/README.txt
 http://people.netfilter.org/hawk/qdisc/experiment01/qdisc_prio_hol.conf
 https://github.com/netoptimizer/netperf-wrapper/commit/7d0241a78e5

The test includes both a TCP_RR and UDP_RR test that derive the
latency, also kept the ping tests for comparison.

One problem: The NoneXSO test is basically invalid, because I cannot
make it exhaust the bandwidth, see "Total Upload":
 http://people.netfilter.org/hawk/qdisc/experiment01/qdisc_prio_hol__totals--NoneXSO_net_next.png

Looking at the ping test, there is a clear difference between priority
bands, this just shows that the priority band are working as expected
and the qdisc is backlogged.
 http://people.netfilter.org/hawk/qdisc/experiment01/qdisc_prio_hol__ping--GSO_net_next.png
E.g. ping test for NoneXSO show it is not backlogged, a broken test:
 http://people.netfilter.org/hawk/qdisc/experiment01/qdisc_prio_hol__ping--NoneXSO_net_next.png


Zooming in on the high priority band, we see how the different
high-prio band measurements are working.
Here for GSO:
 http://people.netfilter.org/hawk/qdisc/experiment01/qdisc_prio_hol__ping_hiprio--GSO_net_next.png
Here for TSO:
 http://people.netfilter.org/hawk/qdisc/experiment01/qdisc_prio_hol__ping_hiprio--TSO_net_next.png

I've created a new graph called "rr_latency" that further zooms in on
the difference between TCP_RR and UDP_RR measurements:
Here for GSO:
 http://people.netfilter.org/hawk/qdisc/experiment01/qdisc_prio_hol__rr_latency--GSO_net_next.png
Here for TSO:
 http://people.netfilter.org/hawk/qdisc/experiment01/qdisc_prio_hol__rr_latency--TSO_net_next.png
A compare graph:
 http://people.netfilter.org/hawk/qdisc/experiment01/compare_TSO_vs_GSO__rr_latency.png

I found the interactions a little strange in the above graphs.


Even more strange, I started to play with the ixgbe cleanup interval,
adjusting via cmdline:
 sudo ethtool -C eth4 rx-usecs 30

Then the "rr_latency" graph change, significantly lowering the latetency.
Here for GSO:
 http://people.netfilter.org/hawk/qdisc/experiment01/qdisc_prio_hol__rr_latency--rxusecs30_GSO_net_next.png
Here for TSO:
 http://people.netfilter.org/hawk/qdisc/experiment01/qdisc_prio_hol__totals--rxusecs30_TSO_net_next.png

Compare graph for GSO:
 http://people.netfilter.org/hawk/qdisc/experiment01/compare_GSO_vs_GSO_with_rxusec30__rr_latency.png
Compare graph for TSO:
 http://people.netfilter.org/hawk/qdisc/experiment01/compare_TSO_vs_TSO_with_rxusec30__rr_latency.png
Comparing TSO vs GSO both with rx-usecs 30, which is almost equal.
 http://people.netfilter.org/hawk/qdisc/experiment01/compare_TSO_vs_GSO_both_with_rxusec30__rr_latency.png


Checking ping, still follow TCP_RR and UDP_RR, with rx-usecs 30:
 http://people.netfilter.org/hawk/qdisc/experiment01/qdisc_prio_hol__ping_hiprio--rxusecs30_GSO_net_next.png
 http://people.netfilter.org/hawk/qdisc/experiment01/qdisc_prio_hol__ping_hiprio--rxusecs30_TSO_net_next.png

--
Best regards,
  Jesper Dangaard Brouer
  MSc.CS, Sr. Network Kernel Developer at Red Hat
  Author of http://www.iptv-analyzer.org
  LinkedIn: http://www.linkedin.com/in/brouer

^ permalink raw reply	[flat|nested] 13+ messages in thread
* Re: Qdisc: Measuring Head-of-Line blocking with netperf-wrapper
  2014-09-16 15:56     ` Jesper Dangaard Brouer
@ 2014-09-16 16:08       ` Dave Taht
  2014-09-16 16:30       ` Eric Dumazet
  1 sibling, 0 replies; 13+ messages in thread
From: Dave Taht @ 2014-09-16 16:08 UTC (permalink / raw)
  To: Jesper Dangaard Brouer
  Cc: Eric Dumazet, netdev@vger.kernel.org, Stephen Hemminger,
	Tom Herbert, David Miller, Hannes Frederic Sowa, Daniel Borkmann,
	Florian Westphal, Toke Høiland-Jørgensen

On Tue, Sep 16, 2014 at 6:56 PM, Jesper Dangaard Brouer
<brouer@redhat.com> wrote:
> On Tue, 16 Sep 2014 06:59:19 -0700
> Eric Dumazet <eric.dumazet@gmail.com> wrote:
>
>> With the TCP usec rtt work I did lately, you'll get more precise results
>> from a TCP_RR flow, as Tom and I explained.
>
> Here you go, developed a new test:
>  http://people.netfilter.org/hawk/qdisc/experiment01/README.txt
>  http://people.netfilter.org/hawk/qdisc/experiment01/qdisc_prio_hol.conf
>  https://github.com/netoptimizer/netperf-wrapper/commit/7d0241a78e5
>
> The test includes both a TCP_RR and UDP_RR test that derive the
> latency, also kept the ping tests for comparison.

You have incidentally overwhelmed *me* with data. Thank you very much
for including the *.json* files in your experiments, I'll be able to parse
and compare them later with netperf-wrapper when I get more time.

> One problem: The NoneXSO test is basically invalid, because I cannot
> make it exhaust the bandwidth, see "Total Upload":
>  http://people.netfilter.org/hawk/qdisc/experiment01/qdisc_prio_hol__totals--NoneXSO_net_next.png

Well, i've long conceded that TSO and GSO offloads were needed at 10GigE speeds.
I'd love to get a grip on how bursty they are since some moderation
fixes landed a few
versions back.

>
> Looking at the ping test, there is a clear difference between priority
> bands, this just shows that the priority band are working as expected
> and the qdisc is backlogged.
>  http://people.netfilter.org/hawk/qdisc/experiment01/qdisc_prio_hol__ping--GSO_net_next.png
> E.g. ping test for NoneXSO show it is not backlogged, a broken test:
>  http://people.netfilter.org/hawk/qdisc/experiment01/qdisc_prio_hol__ping--NoneXSO_net_next.png
>

I look forward to seeing sch_fq and fq_codel data, for comparison.

>
> Zooming in on the high priority band, we see how the different
> high-prio band measurements are working.
> Here for GSO:
>  http://people.netfilter.org/hawk/qdisc/experiment01/qdisc_prio_hol__ping_hiprio--GSO_net_next.png
> Here for TSO:
>  http://people.netfilter.org/hawk/qdisc/experiment01/qdisc_prio_hol__ping_hiprio--TSO_net_next.png
>
> I've created a new graph called "rr_latency" that further zooms in on
> the difference between TCP_RR and UDP_RR measurements:
> Here for GSO:
>  http://people.netfilter.org/hawk/qdisc/experiment01/qdisc_prio_hol__rr_latency--GSO_net_next.png
> Here for TSO:
>  http://people.netfilter.org/hawk/qdisc/experiment01/qdisc_prio_hol__rr_latency--TSO_net_next.png
> A compare graph:
>  http://people.netfilter.org/hawk/qdisc/experiment01/compare_TSO_vs_GSO__rr_latency.png
>
> I found the interactions a little strange in the above graphs.


I note that toke had started coding netperf-wrapper back in the day
when 10mbits and RTTs measured in seconds were the norm. I am
DELIGHTED to see it works at all at 10GigE. Other network measurement
tools, like netalyzr, peak out at 20mbits....

You can capture more detail about the tc setup, in particular, if you
invoke it with the -x option.

You might get more detail on your plots if you run as root with
--step-size .01 for a 10ms sampling interval
rather than a 200ms one. This doesn't quite work on a few older tests,
notably rrul.

> Even more strange, I started to play with the ixgbe cleanup interval,
> adjusting via cmdline:
>  sudo ethtool -C eth4 rx-usecs 30
>
> Then the "rr_latency" graph change, significantly lowering the latetency.
> Here for GSO:
>  http://people.netfilter.org/hawk/qdisc/experiment01/qdisc_prio_hol__rr_latency--rxusecs30_GSO_net_next.png
> Here for TSO:
>  http://people.netfilter.org/hawk/qdisc/experiment01/qdisc_prio_hol__totals--rxusecs30_TSO_net_next.png

There is always a tradeoff between better batching and better latency.
I've kind of hoped that with the new post-ivy-bridge architectures,
that the weight, even napi weight, was shifting towards dealing with
low latency packets already in cache was more efficient than batching
up processing. The numbers the DPDK folk were getting were astounding.

(but still can't make heads or tails of where you are going with all this)

> Compare graph for GSO:
>  http://people.netfilter.org/hawk/qdisc/experiment01/compare_GSO_vs_GSO_with_rxusec30__rr_latency.png
> Compare graph for TSO:
>  http://people.netfilter.org/hawk/qdisc/experiment01/compare_TSO_vs_TSO_with_rxusec30__rr_latency.png
> Comparing TSO vs GSO both with rx-usecs 30, which is almost equal.
>  http://people.netfilter.org/hawk/qdisc/experiment01/compare_TSO_vs_GSO_both_with_rxusec30__rr_latency.png
>
>
> Checking ping, still follow TCP_RR and UDP_RR, with rx-usecs 30:
>  http://people.netfilter.org/hawk/qdisc/experiment01/qdisc_prio_hol__ping_hiprio--rxusecs30_GSO_net_next.png
>  http://people.netfilter.org/hawk/qdisc/experiment01/qdisc_prio_hol__ping_hiprio--rxusecs30_TSO_net_next.png

I have generally found that it is easier to present all this data on
graphs or combined graph, on a web page, rather than in email.

> --
> Best regards,
>   Jesper Dangaard Brouer
>   MSc.CS, Sr. Network Kernel Developer at Red Hat
>   Author of http://www.iptv-analyzer.org
>   LinkedIn: http://www.linkedin.com/in/brouer


--
Dave Täht

https://www.bufferbloat.net/projects/make-wifi-fast

^ permalink raw reply	[flat|nested] 13+ messages in thread
* Re: Qdisc: Measuring Head-of-Line blocking with netperf-wrapper
  2014-09-16 15:56     ` Jesper Dangaard Brouer
  2014-09-16 16:08       ` Dave Taht
@ 2014-09-16 16:30       ` Eric Dumazet
  2014-09-17  7:39         ` Jesper Dangaard Brouer
  1 sibling, 1 reply; 13+ messages in thread
From: Eric Dumazet @ 2014-09-16 16:30 UTC (permalink / raw)
  To: Jesper Dangaard Brouer
  Cc: netdev@vger.kernel.org, Stephen Hemminger, Tom Herbert,
	David Miller, Hannes Frederic Sowa, Daniel Borkmann,
	Florian Westphal, Toke Høiland-Jørgensen, Dave Taht

On Tue, 2014-09-16 at 17:56 +0200, Jesper Dangaard Brouer wrote:
> On Tue, 16 Sep 2014 06:59:19 -0700
> Eric Dumazet <eric.dumazet@gmail.com> wrote:
>
> > With the TCP usec rtt work I did lately, you'll get more precise results
> > from a TCP_RR flow, as Tom and I explained.
>
> Here you go, developed a new test:

Just to make sure I understand (sorry I dont have time going all your
graphs right now)

The target of your high prio flow is different from target of the
antagonist flows ?

Otherwise, you are not only measuring head of line blocking of your
host, but the whole chain, including scheduling latencies of the
(shared) target.

^ permalink raw reply	[flat|nested] 13+ messages in thread
* Re: Qdisc: Measuring Head-of-Line blocking with netperf-wrapper
  2014-09-16 16:30       ` Eric Dumazet
@ 2014-09-17  7:39         ` Jesper Dangaard Brouer
  0 siblings, 0 replies; 13+ messages in thread
From: Jesper Dangaard Brouer @ 2014-09-17  7:39 UTC (permalink / raw)
  To: Eric Dumazet
  Cc: netdev@vger.kernel.org, Stephen Hemminger, Tom Herbert,
	David Miller, Hannes Frederic Sowa, Daniel Borkmann,
	Florian Westphal, Toke Høiland-Jørgensen, Dave Taht,
	brouer

On Tue, 16 Sep 2014 09:30:16 -0700
Eric Dumazet <eric.dumazet@gmail.com> wrote:

> On Tue, 2014-09-16 at 17:56 +0200, Jesper Dangaard Brouer wrote:
> > On Tue, 16 Sep 2014 06:59:19 -0700
> > Eric Dumazet <eric.dumazet@gmail.com> wrote:
> >
> > > With the TCP usec rtt work I did lately, you'll get more precise results
> > > from a TCP_RR flow, as Tom and I explained.
> >
> > Here you go, developed a new test:
>
> Just to make sure I understand (sorry I dont have time going all your
> graphs right now)

Summary for you:
1) I have created the TCP_RR latency test you and Tom asked for.

2) Graphs shows TCP_RR and UDP_RR are more accurate than ping

3) Graphs shows that ping is within same range as TCP_RR and UDP_RR

4) My only problem, NoneXSO case does not work with TCP_RR, and
   I need the NoneXSO case for evaluating my qdisc bulking patches.

> The target of your high prio flow is different from target of the
> antagonist flows ?
>
> Otherwise, you are not only measuring head of line blocking of your
> host, but the whole chain, including scheduling latencies of the
> (shared) target.

For the target-host I'm avoiding the problem, as it receives packets on
different HW queue and netservers will be running on different CPUs.

For the host, I'm by design, forcing it to run on the same single CPU,
to force using the same HW queue, so I can measure this HW queue and
its/BQLs push back. So, yes the host, is also affected by scheduling
latencies, which is bad. (perhaps reason NoneXSO cannot util BW).

How can I construct a test-case, on the host, to solve this problem?
(and still using/measuring the same xmit HW queue)


--
Best regards,
  Jesper Dangaard Brouer
  MSc.CS, Sr. Network Kernel Developer at Red Hat
  Author of http://www.iptv-analyzer.org
  LinkedIn: http://www.linkedin.com/in/brouer

^ permalink raw reply	[flat|nested] 13+ messages in thread
end of thread, other threads:[~2014-09-17  7:40 UTC | newest]

Thread overview: 13+ messages (download: mbox.gz follow: Atom feed
-- links below jump to the message on this page --
2014-09-15 16:45 Qdisc: Measuring Head-of-Line blocking with netperf-wrapper Jesper Dangaard Brouer
2014-09-15 17:10 ` Tom Herbert
2014-09-15 17:24   ` Eric Dumazet
2014-09-15 18:55     ` Dave Taht
2014-09-15 19:12       ` Rick Jones
2014-09-16  6:30     ` Jesper Dangaard Brouer
2014-09-16 15:52       ` Tom Herbert
2014-09-16 13:22 ` Jesper Dangaard Brouer
2014-09-16 13:59   ` Eric Dumazet
2014-09-16 15:56     ` Jesper Dangaard Brouer
2014-09-16 16:08       ` Dave Taht
2014-09-16 16:30       ` Eric Dumazet
2014-09-17  7:39         ` Jesper Dangaard Brouer
This is a public inbox, see mirroring instructions
for how to clone and mirror all data and code used for this inbox;
as well as URLs for NNTP newsgroup(s).